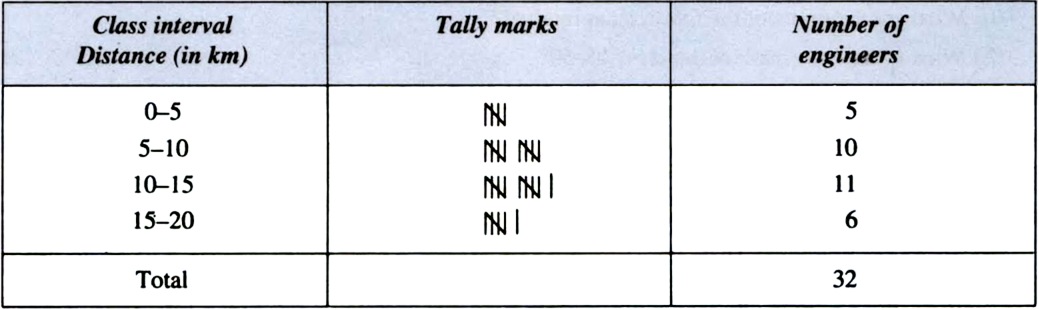
The distance in km of 32 engineers from their residence to their place of work were found as follows:
4, 6, 10,12, 8, 13, 12, 9, 11, 16, 10, 18, 15, 3, 8, 4,
10, 8, 7, 9, 5, 15, 18, 3, 11, 15, 2, 10, 14, 7, 6, 12
Construct a grouped frequency distribution table with class-size for the data given above taking the first interval as 0–5.

The weights (in grams) of 30 apples picked at random from a basket of oranges are given below:
45, 55, 30, 110,75, 100, 40, 60, 65, 40, 100, 75, 70, 60, 70, 70, 60, 95, 85, 80, 35, 45,40, 50, 60, 65, 55, 45, 30, 90
Prepare a frequency distribution table in which the size of class intervals is the same and one class interval is 30–40.
The marks obtained out of 75 by 30 students of a class in an examination are given below:
42, 21, 50, 37,42, 37, 38, 42, 49, 52, 38, 53, 57, 47, 29, 59, 61, 33, 17, 17, 39, 44, 42, 39, 14, 7, 27, 19, 54, 51
Prepare a frequency distribution table in which the size of class intervals is the same and one class interval is 0–10.
In a specific year, the distribution of the ages (in years) of primary teachers of a district is given:
|
Age (in years) |
Number of teachers |
|
15–20 |
10 |
|
20–25 |
30 |
|
25–30 |
50 |
|
30–35 |
50 |
|
35–40 |
30 |
|
40–45 |
6 |
|
45–50 |
4 |
(i) What is the lower limit of the first class interval?
(ii) What are the limits of the fourth class interval?
(iii) What is the class mark of the class 45–50?
A part of the frequency table is given below:
|
Class marks of weights (in kg) |
No. of students |
|
33 |
9 |
|
38 |
5 |
|
43 |
14 |
Rewrite the table with class limits.