What is velocity-time graph of a body? Draw velocity-time graphs for
(i) a body moving with uniform velocity,
(ii) a body moving with uniform acceleration, and
(iii) a body moving with variable acceleration.
Velocity-time graph. It is the graph obtained by plotting velocity of the body along Y-axis and time along X-axis.
(i) Velocity-time graph for uniform velocity. For a body moving with a constant velocity, the velocity-time graph is a straight line parallel to the time-axis, as shown in Fig. (a).
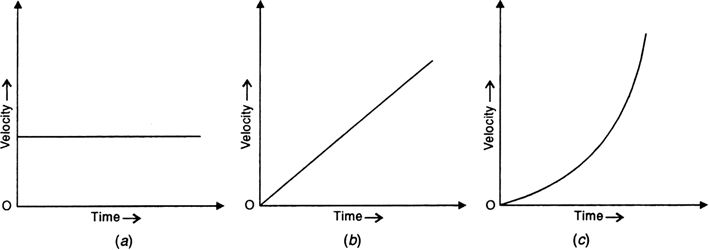
(ii) Velocity-time graph for uniform acceleration. For a body in uniform acceleration, the increase in velocity is proportional to the time taken. So velocity-time graph is a straight line inclined to the time-axis, as shown in Fig. (b).
(iii) Velocity-time graph for variable acceleration. For a body having variable acceleration, the velocity increases by unequal amounts in equal intervals of time. So velocity-time graph is a curve, as shown in Fig. (c).

When do you say a body is in
(i) uniform acceleration, and
(ii) variable acceleration?
What are the uses of graphical study of motion?
What is distance-time graph of a body? Draw distance-time graphs for,
(i) a stationary body,
(ii) a body moving with uniform velocity, and
(iii) a body moving with variable velocity.
A train moves with a speed of 30 km/h in the first 15 minutes, with another speed of 40 km/h in the next 15 minutes and then with a speed of 60 km/h in the last 30 minutes. Calculate the average speed of the train for this journey.