Business Analytics - Introduction, Course and Certification. Read Through For Future Excellence.
Posts published in “Data Science”
Data science is an inter-disciplinary area that uses scientific methods, processes, statistical concepts, algorithms and systems / languages to extract knowledge and hindsight to insights to foresight from many structural and unstructured data. Data science is related to data modeling, data mining, Artificial Intelligence, machine learning and big data.
Data science is becoming a hot topic of discussion around the world. Data science is a technology that uses mathematics, probabilities, statistical analysis, algorithms to process data into various buckets…
Python is an interpreted, object-oriented, high-level programming language with dynamic semantics. Its high-level built-in data structures, combined with dynamic typing and dynamic binding, make it very attractive for Rapid Application…
Databases are critical for storing and processing data even if you consider a powerful programming language like Python. Ever wondered where does this whole large set of data is stored…
Python programming language provides the following types of loops to handle looping requirements. Python provides three ways for executing the loops. While all the ways provide similar basic functionality, they…
Under certain conditions, some decisions are sometimes in normal life inevitable, as we can see in our photo. It’s the same for every program, which has to solve some useful…
In this article, you’ll learn everything about different types of operators in Python, their syntax and how to use them with examples. What are operators in python? Operators are special…
Think of a variable as a name attached to a particular object. In Python, variables need not be declared or defined in advance, as is the case in many other…
Before you start writing your first Python program, you’ve got to learn the basics. We will walk you through Python syntax basics that will help as a building block for…
Python is one of the fastest-growing programming languages nowadays and is used for machine learning, data science, and a lot of other use cases. The best way to start learning…
What’s leaflet? The leaflet is an open-source JavaScript library for interactive web maps. The leaflet is designed with simplicity, performance, and usability in mind. It’s lightweight, simple, and flexible, and is probably the most popular open-source mapping library…
Large data sets are often awash with data that is difficult to decipher. One may think of textual data, names, unique identifiers, and other sorts of codes. Frequently, people analyzing…
Creating and generating plots can be done using a new package in R called “plotly”. With plotly we can create many interactive plots. In this article, we’ll learn how to…
In this article, we’ll learn about a new package in R called ‘DT’. The default print function in R, is not an effective way to display the contents, especially in…
Time series analysis in R requires a specific format of date objects. Lubridate is a package useful to create those objects. Lubridate is an R package that makes it easier to work…
We all know the many hours spent cleaning and wrangling data. Sometimes I think my actual job is not “Data Scientist” but “Data Cleaner”.Data, as you surely know, is not often…
What is dplyr ? dplyr is a powerful R-package to transform, summarize, and perform data manipulation. The package contains a set of functions (or “verbs”) that perform common data manipulation…
You can save an R object like a data frame as either an RData file or an RDS file. RData files can store multiple R objects at once, but RDS…
In R, functions are objects in their own right. They aren’t automatically bound to a name. Unlike many languages (e.g., C, C++, Python, and Ruby), R doesn’t have a special…
tidyr is new package that makes it easy to “tidy” your data. Tidy data is data that’s easy to work with: it’s easy to munge (with dplyr), visualise (with ggplot2…
In this article, we’ll learn what functions are and all the parts inside a function in R. A function is a set of statements organized together to perform a specific…
Arguments are always named when we define any function. When the function is called you do not have to specify the name of the argument. Arguments are optional; you do…
In this article, we’ll learn about the scope of variables and how each of the scope works inside a function and outside a function in R. Within a function in…
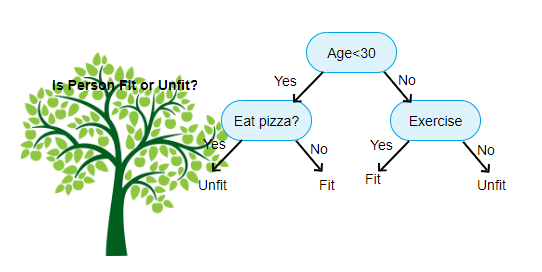
Decision Trees are versatile Machine Learning algorithm that can perform both classification and regression tasks. They are very powerful algorithms, capable of fitting complex datasets. Besides, decision trees are fundamental components…
Poisson Regression can be a really useful tool if you know how and when to use it. In this article we’re going to take a long look at Poisson Regression,…
Logistic regression is yet another technique borrowed by machine learning from the field of statistics. It’s a powerful statistical way of modeling a binomial outcome with one or more explanatory…
R is one of the most important languages in the field of data analysis and analytics, and so the multiple linear regression in R carries importance. It defines the case where a single response variable Y is linearly dependent on multiple predictor variables. What is Multiple Linear Regression? A technique used for predicting a variable result that depends on two or more variables is a multilinear regression. It is also called multiple regression. It is a linear regression extension. The calculated variable is the dependent variable, which is referred to as independent or informative variables in the variables used to predict the dependent variable meaning. Multilinear regression allows researchers to assess the model variance and the relative contribution of each independent variable. Multiple regression is of two forms, linear and nonlinear regression. The general mathematical equation for multiple regression is − y = b + b1x1 + b2x2 +...bnxn Description of the parameters used…
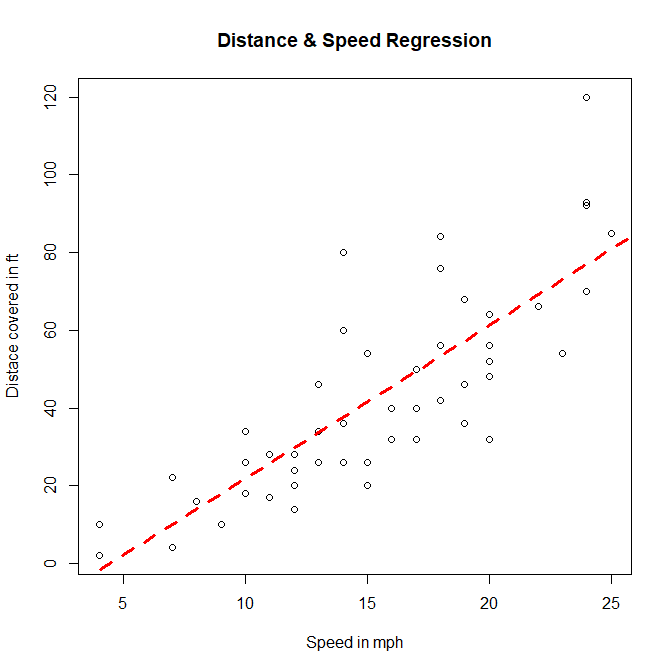
In this article, you will learn the basics behind a very popular statistical model, the linear regression. What is Linear Regression In statistics, linear regression is a linear approach to modeling the relationship between a scalar response…
In this article, you’ll learn Statistical functions used in R. We will also be each one of them with an example and various ways to use them for better understanding.…
People remain uncertain when it comes to summarizing actual data easily in R. There are a variety of choices. So who is the right one? I addressed the query below. At first, you must pick one. And become an expert on this. That’s how you’re going to switch to the next. In this article, I will discuss the primary methods of summarizing data sets. Let’s hope this makes the trip much smoother than it seems. Methods for summarizing data in R apply() Apply function returns a vector or array or a list of values achieved by applying a function to rows or columns. This is the easiest of all the tasks that can do this work. However, this feature is very unique to either row or column collapsing. Usage Arguments Values Description x an array, including a matrix. MARGIN a vector giving the subscripts which the function will be applied over. E.g., for…
In this article, you’ll learn how to draw elements randomly from an object in R. We will also be creating objects with random values all this using just one function…
In this tutorial, we will learn about Normal Distribution in R. We will cover different functions which helps in generating the normal distribution. Along with this, we will also include…
R’s coercion behavior may seem inconvenient, but it is not arbitrary. R always follows the same rules when it coerces data types. Once you are familiar with these rules, you…
R Packages /Libraries Packages in R comprise of R functions, data and compiled code that are present in a well-defined format. The location where the packages are installed is known…
In this article, you’ll learn how to add date and time in R. Dates and times are very frequently used concepts in data analysis. R provides a broad range of…
In this article, you’ll learn how to merge objects in R. Merging objects is a very frequently used concept in data analysis. R provides a broad range of capabilities to…
R’s subsetting operators are powerful and fast. Mastery of subsetting allows you to succinctly express complex operations in a way that few other languages can match. As an illustration in…
In this article, you’ll learn about constants in R. And how to use them. Constants, as the name suggests, are entities whose value cannot be altered. Basic types of constant…
This article explain how to recognise and erase duplicate data in R. You’ll learn how to use the following R base and dplyr functions: R base functions duplicated() determines which elements of a vector or data frame are duplicates of elements with smaller subscripts, and returns a logical vector indicating which elements (rows) are…
Since R runs on so many different operating systems, and supports so many different graphics formats, it’s not surprising that there are a variety of ways of saving your plots,…
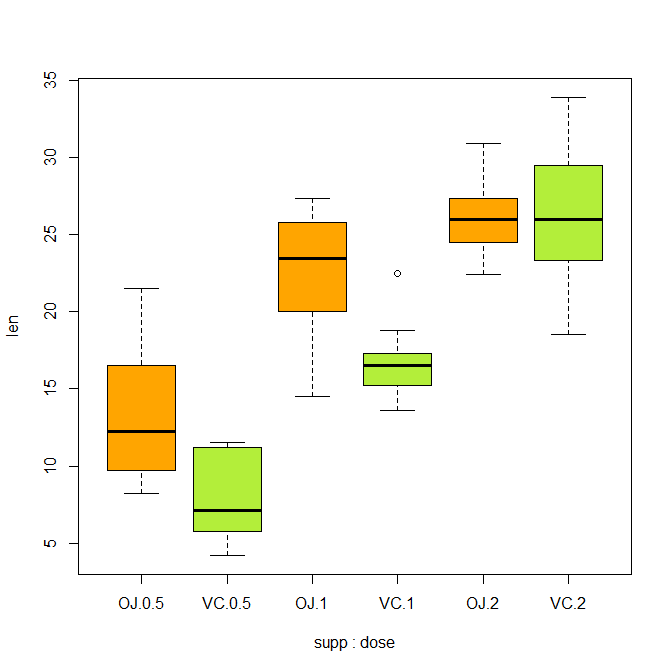
In this article, you’ll learn how to box plot in R. We will also be creating an example plot and will make various changes to the same existing plot for…
Multi-panel plots and figures are used everywhere, especially in scientific papers to compare different graphs or datasets. And creating them has never been easier using R! There are several functions…
To plot more than one curve on a single plot in R, we proceed as follows. Create the first plot using the plot() function. For the subsequent plots, do not use the plot() function,…
In this article, you’ll learn how to change the type of a plot in R. We will also be creating an example plot and will make the type changes to…
In this article, you’ll learn how to add text to a plot. We will also be creating a plot and will try various aesthetic manipulations in the same plot, like…
Today, In this article we will learn how to add a legend to a plot and make it more informative and also look at the different types of legends and…
In this article, you’ll learn how to add/change the color of points, text and lines. We will also be creating a plot and will try various aesthetic manipulations in the…
You can easily add the main title and axis labels with arguments to the plot() function in R to enhance the quality of your graphic. Usage Arguments x the coordinates of points in…
In this article, you’ll learn to use the plot function in R. We will also be creating our very own first plot. The most used plotting function in R programming…
