Large data sets are often awash with data that is difficult to decipher. One may think of textual data, names, unique identifiers, and other sorts of codes. Frequently, people analyzing…
Posts tagged as “Plot”
Since R runs on so many different operating systems, and supports so many different graphics formats, it’s not surprising that there are a variety of ways of saving your plots,…
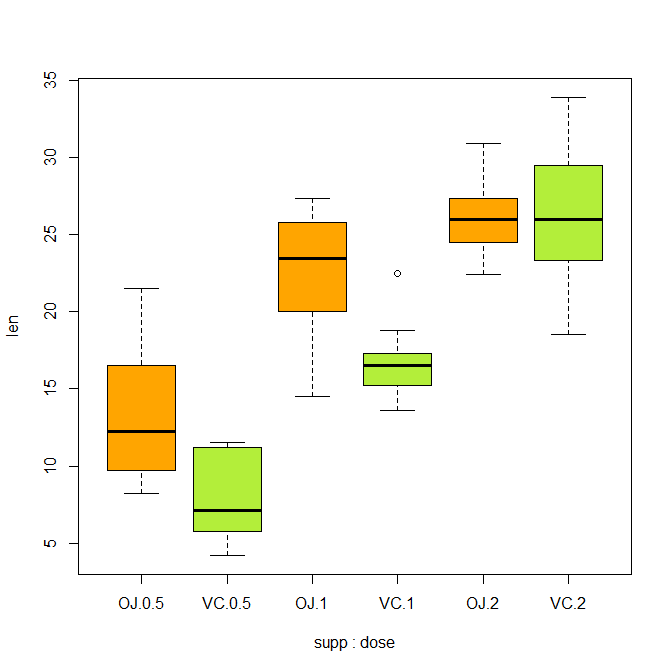
In this article, you’ll learn how to box plot in R. We will also be creating an example plot and will make various changes to the same existing plot for…
Multi-panel plots and figures are used everywhere, especially in scientific papers to compare different graphs or datasets. And creating them has never been easier using R! There are several functions…
To plot more than one curve on a single plot in R, we proceed as follows. Create the first plot using the plot() function. For the subsequent plots, do not use the plot() function,…
In this article, you’ll learn how to change the type of a plot in R. We will also be creating an example plot and will make the type changes to…
In this article, you’ll learn how to add text to a plot. We will also be creating a plot and will try various aesthetic manipulations in the same plot, like…
Today, In this article we will learn how to add a legend to a plot and make it more informative and also look at the different types of legends and…
In this article, you’ll learn how to add/change the color of points, text and lines. We will also be creating a plot and will try various aesthetic manipulations in the…
You can easily add the main title and axis labels with arguments to the plot() function in R to enhance the quality of your graphic. Usage Arguments x the coordinates of points in…
In this article, you’ll learn to use the plot function in R. We will also be creating our very own first plot. The most used plotting function in R programming…
