 Short Answer Type
Vapour pressures of pure acetone and chloroform at 328 k are 741.8 nm Hg and 632.8 mm Hg respectively. Assuming that they form ideal solution over the entire range of composition, plot Ptotal , Pchlroform and Pacelone as a function of Xactone. The experimental date observed for different composition of mixture is:
|
100 x xacetone |
0 |
11.8 |
23.8 |
36.0 |
50.8 |
58.2 |
64.5 |
72.1 |
|
Pacetone / mm Hg
|
0 |
54.9 |
110.1 |
202.4 |
327.7 |
405.9 |
454.1 |
521.1 |
|
Pchloroform/ mm Hg |
632.8 |
548.1 |
469.4 |
359.7 |
257.7 |
193.6 |
161.2 |
120.7 |
Plot this data also on the same graph paper, indicate whether it has positive deviation or negative deviation from the ideal solution.
 Long Answer Type
 Short Answer Type
 Long Answer Type
Osmotic pressure: Osmotic pressure is the minimum pressure that should be applied to the more concentrated solution to prevent osmosis.
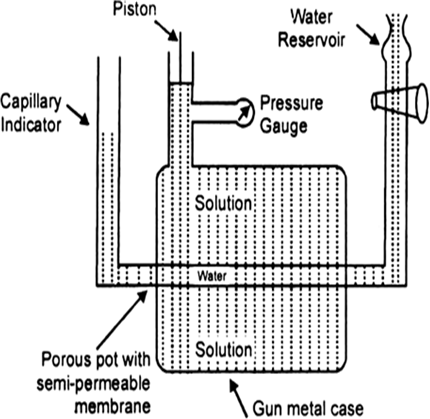
Determination of osmotic pressure: Barkley and Hartley’s method: The apparatus consists of a porous pot containing copper ferrocyanide deposited in its wall (acts as semipermeable membrane) and fitted into a bronze cylinder to which is fitted a piston and a pressure gauge (to read the applied pressure).
The pot is fitted with a capillary indicator on left and water reservoir on right. Pot is filled with water while the cylinder is filled with a solution whose osmotic pressure is to be measured. Water tends to pass into the solution through the semipermeable membrane with the result that the water level in the indicator falls down. External pressure is now applied with piston so as to maintain a constant level in the indicator. This external pressure is osmotic pressure.
If the membrane used was a slightly, leaky, then the measured valued of osmotic pressure will not be definite.
Fig. Barkley and Hartley’s apparatus.
 Short Answer Type
 Long Answer Type