Important Questions of Data Handling Mathematics | Zigya

Previous Year Papers

Download Solved Question Papers Free for Offline Practice and view Solutions Online.

Test Series

Take Zigya Full and Sectional Test Series. Time it out for real assessment and get your results instantly.

Test Yourself

Practice and master your preparation for a specific topic or chapter. Check you scores at the end of the test.
Advertisement

 Multiple Choice QuestionsShort Answer Type

Advertisement
61. A bag has 4-red balls and 2 yellow balls such that the balls are identical in all repeats other than colour. A ball is drawn from the bag without looking into the bag. What is the probability of getting yellow ball?
114 Views

62. Given below are the marks obtained by 30 students of a class in a test.
10, 8, 12, 17, 19, 17, 41, 40, 12, 46, 37, 17, 1, 9, 21, 13, 48, 12, 21, 19, 33, 5, 38, 39, 19, 23, 2, 6, 30, 27.
Using tally marks prepare a frequency table such that 20-30 is a class interval.

340 Views

 Multiple Choice QuestionsLong Answer Type

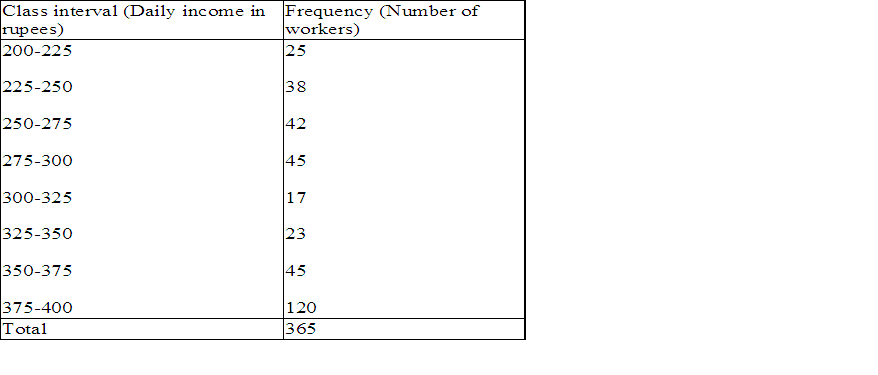
63. Study the following frequency table and answer the questions given below.
(i) What is the class interval?
(ii) Which class has the lowest frequency?
(iii) Which class has the highest frequency?
(iv) Which two classes have the same frequency?
(v) What is the lower limit of the class-interval 300-325?
(vi) What is the upper limit of the class interval 275—300?


224 Views

 Multiple Choice QuestionsShort Answer Type

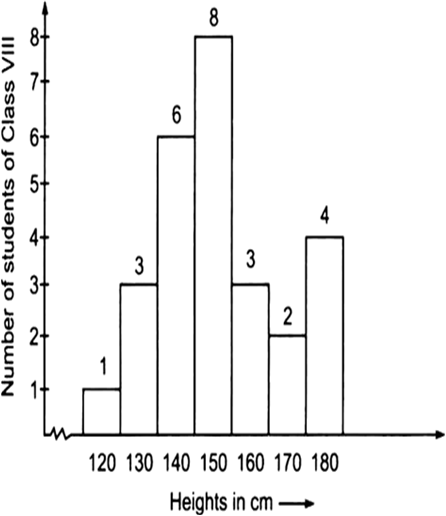
64. Observe the following histogram and answer the questions given below:


(i) What information is being given by the histogram?
(ii) Which group contains the maximum students?
(iii) How many students have a height of 160 cm and more?
(iv) What is the ratio of the number students in 130-140 cm group and the number of students in 160–170 cm groups?
163 Views

Advertisement
65.

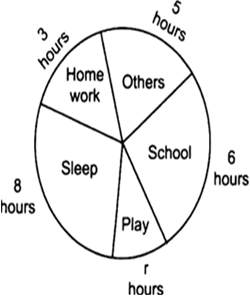
Look at the adjoining circle graph and answer the following questions.
(i) What is the central angle corresponding to the activities "school and home work"?
(ii) Find the fraction of the circle representing each of these given information.

86 Views

 Multiple Choice QuestionsLong Answer Type

66. On a particular day, the sales (in rupees) of different items of a store are given below:
                 Calculators :  8000
                 Cell phones :  22000
   Cell phones batteries : 4000
   Cell phones chargers : 2000
Draw a pie-chart for the above data.

124 Views

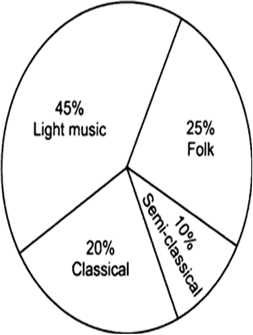
67. The adjoining pie-chart shows the findings of a survey in respect of type of music that a certain group of young people liked in a city. From this pie chart answer the following:
(i) If 30 people liked the folk dance, how many people were surveyed?
(ii) Which types of music is liked by the minimum number of people?
(iii) Which type of music is liked by the maximum number of people?
(iv) If a cassette company were to make 1000 CD's how many of each type would they make?
85 Views

68. The number of students in hostel, speaking different languages is given below. Display the data by a pie chart:

455 Views

Advertisement
69.

Numbers 1 to 10 are written on ten separate cards such that one number on one slip. These are mixed well and one slip is chosen from the box without looking into it. What is the probability of:
(i) getting a card on which 7 is written?
(ii) getting a card having two-digit number on it?
(iii) getting a number less than 5?
(iv) getting a number more than 5?

81 Views

70.

When a die is thrown, list the outcomes of an event of getting:
(i) A number less than 5.
(ii) A composite number.
(iii) A prime number.
(iv) A number more than 3.

186 Views

Advertisement