The shoppers who come to a departmental store are marked as: man

Previous Year Papers

Download Solved Question Papers Free for Offline Practice and view Solutions Online.

Test Series

Take Zigya Full and Sectional Test Series. Time it out for real assessment and get your results instantly.

Test Yourself

Practice and master your preparation for a specific topic or chapter. Check you scores at the end of the test.
Advertisement

 Multiple Choice QuestionsLong Answer Type

Advertisement

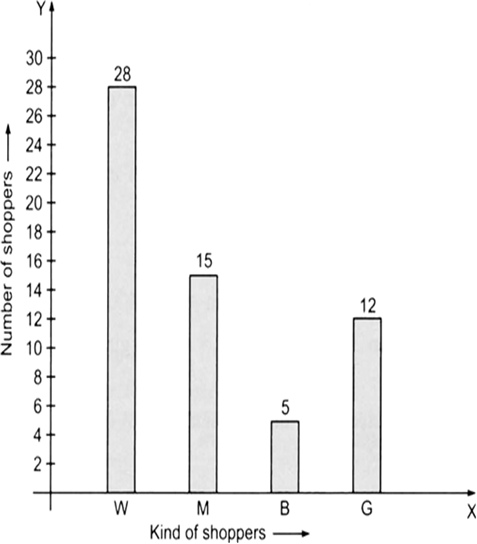
11. The shoppers who come to a departmental store are marked as: man (M), woman (W), boy (B) or girl (G). The following list gives the shoppers who came during the first hour in the morning:
W W W G B W W M G G M M W W W W G B M W B G G M W W M M W W
W M W B W G M W W W W G W M M W W M W G W M G W M M B G G
Make a frequency distribution table using tally marks. Draw a bar graph to illustrate it.


The frequency distribution table for the above data can be:

The frequency distribution table for the above data can be:We can rep

We can represent the above data by a bar graph as given below:


The frequency distribution table for the above data can be:We can rep


179 Views

Advertisement
12.

The weekly wages (in Rs) of 30 workers in a factory are:
830, 835, 890, 810, 835, 836, 869, 845, 898, 890, 820, 860, 832, 833, 855, 845, 804, 808, 812, 840, 885, 835, 835, 836, 878, 840, 868, 890, 806, 840
Using tally marks make a frequency table with intervals as 800–810, 810-820 and so on.

350 Views

13. Draw a histogram for the frequency table made for the data in Question 3, and answer the following questions.
(i) Which group has the maximum number of workers?
(ii) How many workers earn Rs 850 and more?
(iii) How many workers earn less than Rs 850?
162 Views

 Multiple Choice QuestionsShort Answer Type

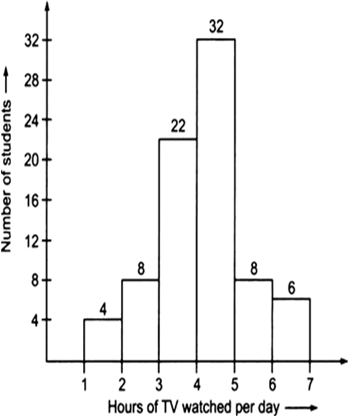
14. The number of hours for which students of a particular class watched television during holidays is shown through the given graph.
Answer the following.
(i) For how many hours did the maximum number of students watch TV?
(ii) How many students watched TV for less than 4 hours?
(iii) How many student spent more than 5 hours in watching TV?
108 Views

Advertisement
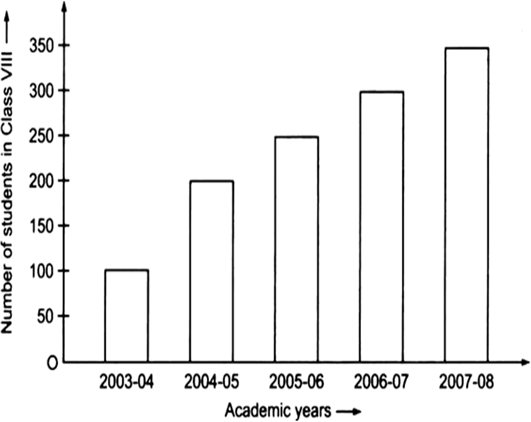
15. Read the following bar-graph and answer the following questions.

(i) What is the information given by the bar graph?
(ii) In which year is the increase in the number of students is maximum?
(iii) In which year is the number of students maximum?
(iv) Is the number of students during 2005-06 twice that of 2003-04?


157 Views

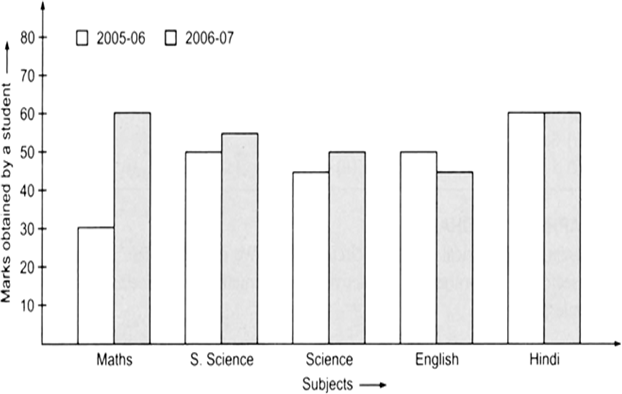
16. Read the following bar-graph and answer the following questions.

(i) What is the information given by the double bar graph?
(ii) In which subject has the performance improved the most?
(iii) In which subject the performance deteriorated?
(iv) In which subject is the performance at par?


214 Views

17. A group of students was asked for their favorite subject. The results were listed as under:

Answer the following questions:
(i) Which is the most liked subject?
(ii) Which is the least liked subject?
195 Views

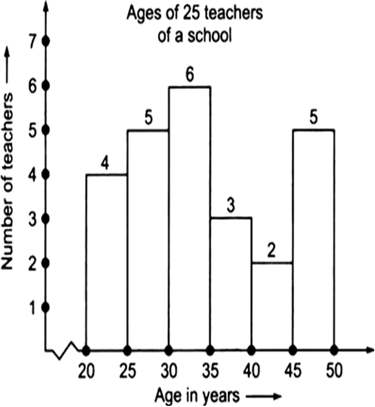
18. Read the following histogram and answer the questions given below:


(i) How many teachers are of age 45 years or more but less than 50 years?
(ii) How many teachers are of age less than 35 years?
474 Views

Advertisement
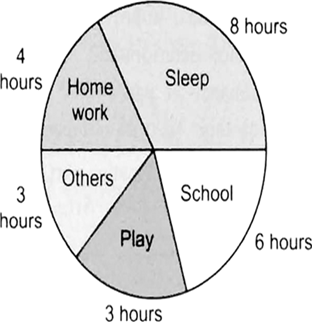
19. Look at the following circle graph and answer the questions given below:

(i) Find the fraction of the circle representing each of these given information.
(ii) What is the central angle corresponding to the activities “Play and Home work” ?

114 Views

 Multiple Choice QuestionsLong Answer Type

20. On a particular day, the sales (in rupees) of different items of a store are given below:
Draw a pie-chart for the above data.
401 Views

Advertisement