Draw a pie chart showing the following information. The table sh

Previous Year Papers

Download Solved Question Papers Free for Offline Practice and view Solutions Online.

Test Series

Take Zigya Full and Sectional Test Series. Time it out for real assessment and get your results instantly.

Test Yourself

Practice and master your preparation for a specific topic or chapter. Check you scores at the end of the test.
Advertisement

 Multiple Choice QuestionsLong Answer Type

21.

Each of the following pie charts gives you a different piece of information about your class. Find the fraction of the circle representing each of these information.


292 Views

 Multiple Choice QuestionsShort Answer Type

22.

Answer the following questions based on the pie chart given.
(i) Which type of programmes are viewed the most?
(ii) Which two types of programmes have number of viewers equal to those watching sports channels?

121 Views

 Multiple Choice QuestionsLong Answer Type

23. Draw a pie chart of the data given below.
The time spent by a child during a day.
                                     Sleep - 8 hours
                                   School - 6 hours
                          Home work   - 4 hours
                                   Play     - 4 hours
                                  others   - 2 hours
1136 Views

 Multiple Choice QuestionsShort Answer Type

24. Which form of graph would be appropriate to display the following data.
Production of food grains of a state.


311 Views

Advertisement
25. Which form of graph would be appropriate to display the following data.
Choice of food for a group of people.


81 Views

26. Which form of graph would be appropriate to display the following data.
 The daily income of a group of a factory workers.


177 Views

 Multiple Choice QuestionsLong Answer Type

27. A survey was made of find the type of music that a certain group of young people liked in a city. Adjoining pie chart shows the findings of this survey.

From this pie chart answer the following:
(i) If 20 people liked classical music, how many young people were surveyed?
(ii) Which type of music is liked by the maximum number of people?
(iii) If a cassette company were to make 1000 CD ’s how many of each type would they make?
103 Views

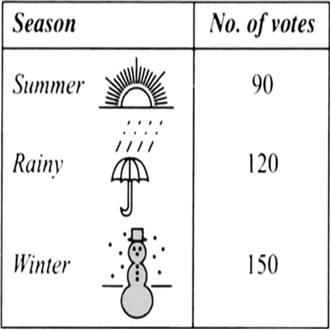
28. A group of 360 people were asked to vote for their favourite season from the three seasons rainy, winter and summer.

(i) Which season got the most votes?
(ii) Find the central angle of each sector.
(iii) Draw a pie chart to show this information.

109 Views

Advertisement
Advertisement

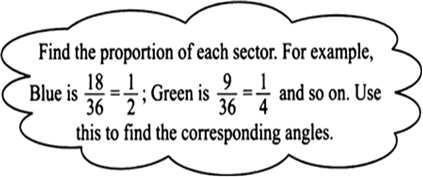
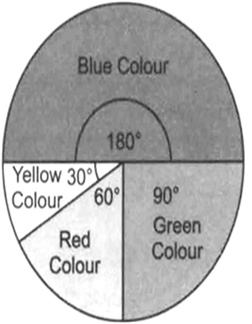
29. Draw a pie chart showing the following information. The table shows the colours preferred by a group of people.


Central angle of the sector corresponding to:
(a) The blue colour = 18 over 36 cross times 360 degree space equals space 18 cross times 10 equals 180 degree
(b) The green colour =  9 over 36 cross times 360 degree space equals space 90 degree
(c) The red colour = 6 over 36 cross times 360 degree space equals space 60 degree
(d) The yellow colour = space 3 over 36 cross times 360 degree space equals space 30 degree
Thus, the required pie chart is given below:

Central angle of the sector corresponding to:(a) The blue colour = (

218 Views

Advertisement
30.

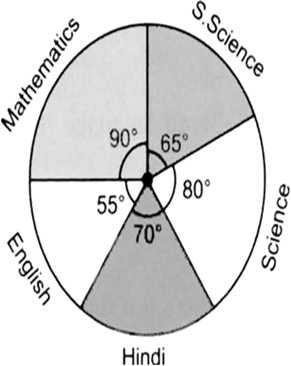
The adjoining pie chart gives the marks scored in an examination by a student in Hindi, English, Mathematics, Social Science and Science. If the total marks obtained by the student were 540, answer the following questions.
(i) In which subject did the student score 105 marks?
(Hint: for 540 marks, the central angle = 360°. So, for 105 marks, what is the central angle?
(ii) How many more marks were obtained by the student in Mathematics than in Hindi?
(iii) Examine whether the sum of the marks obtained in Social Science and Mathematics is more than that in Science and Hindi.
(Hint: Just study the central angles.)
261 Views

Advertisement