Important Questions of Introduction to Graphs Mathematics | Zigya

Previous Year Papers

Download Solved Question Papers Free for Offline Practice and view Solutions Online.

Test Series

Take Zigya Full and Sectional Test Series. Time it out for real assessment and get your results instantly.

Test Yourself

Practice and master your preparation for a specific topic or chapter. Check you scores at the end of the test.
Advertisement

 Multiple Choice QuestionsShort Answer Type

Advertisement
31. The co-ordinates of a quadrilateral ABCD are A(3, 2), B(3, 5) C(–5, 4) and D(0, 1). Draw it on a graph paper.

173 Views

32. Plot the following points on a graph sheet. Verify if they lie on line.
A(5, 0), B(5, -2), C(5, 4), and D(5, 6).
351 Views

33. Draw the graph for the following data:

142 Views

34. Draw the graph for the following table of values of time (in hours) and distances (in km) covered by a car. From the graph, find:
(i) The distance covered by the car during the period 7:00 to 8 :00.
(ii) At what time the car would have covered 180 km?


124 Views

Advertisement
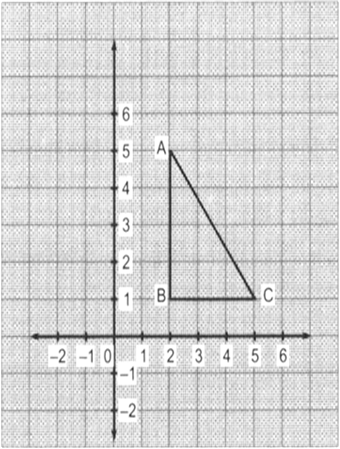
35. Find the coordinates of the vertices of ∆ABC given in graph. Draw a triangle by taking vertices as A(5, 2), B(1, 2) and C(1, 5).

201 Views

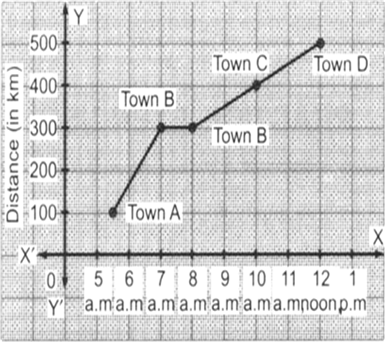
36. Following graph describes the movement of a car from a town A to town D. Study the graph and answer the following questions:

(i) What is the distance between town A and town D?
(ii) When did the car start from town A?
(iii) Where did the car stop and for what duration?
(iv) How long did it take to go from town C to town D?


70 Views

37.

Read the following ‘time-temperature’ graph of a place and answer the questions given below.
(i) What was the temperature at 7 a.m.?
(ii) When the temperature was maximum?


(iii) When was the temperature 40°C?
(iv) During which period, the temperature remained constant?

69 Views

38. The graph shows the temperature of a patient recorded before noon. Read it and answer the following questions.

(i) What was patient’s temperature at 9 a.m.?
(ii) What the highest temperature of the patient?
(iii) When was the patient’s temperature lowest?
(iv) During which period, the patient's temperature remained constant?


77 Views

Advertisement
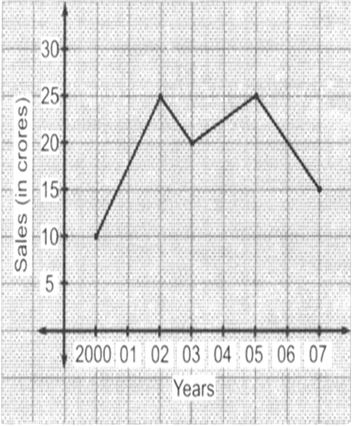
39. The graph shows the yearly sales figure of a shoe manufacturing company.

(i) What were the sales in 2000?
(ii) In which year the sales were maximum?
(iii) What is the difference between the sales in the year 2003 and 2005?

75 Views

40. Draw a linear graph for the following data:


89 Views

Advertisement