What is the lower limit of the modal class of the following fr

Previous Year Papers

Download Solved Question Papers Free for Offline Practice and view Solutions Online.

Test Series

Take Zigya Full and Sectional Test Series. Time it out for real assessment and get your results instantly.

Test Yourself

Practice and master your preparation for a specific topic or chapter. Check you scores at the end of the test.
Advertisement

 Multiple Choice QuestionsShort Answer Type

Advertisement

261.

 What is the lower limit of the modal class of the following frequency distribution ?

Age (in years)

0-10

10-20

20-30

30-40

40-50

50-60

Number of patients

16

13

6

11

27

18


Modal class = 40-50
Lower Limit = 40
791 Views

Advertisement
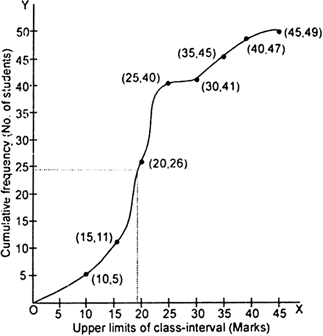
262. A student draws a cumulative frequency curve for the marks obtained by 49 students of a class as shown below, find the median marks obtained by the students of the class.


634 Views

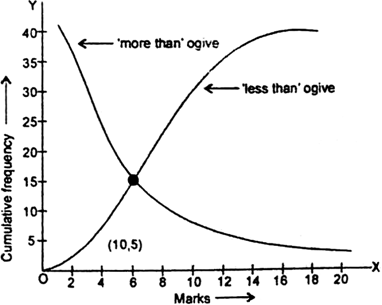
263. What is the value of the median of the data using the graph in figure, of 'less than' ogive and 'more than ogive'?


191 Views

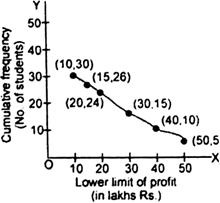
264. A student draws a cumulative frequency curve for the annual p r o f i to earned by 30 shops of a shopping c o m p l e x below, find the median profit obtained by the shops of shopping complex.


80 Views

Advertisement
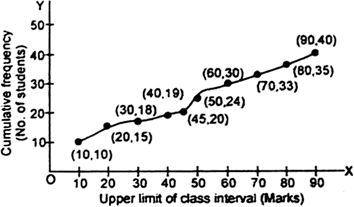
265. A student draws a cumulative frequency curve for the marks obtained by 40 students of a class as shown below, find the median marks obtained by the students of the class.

177 Views

266. Write the formula for finding the mode for grouped data.
99 Views

267. What is the value of the median of the data using the graph in figure, of 'less than' ogive and 'more than ogive'?


416 Views

268. A student draws a cumulative frequency curve for the marks obtained by 40 students of a class as shown below, find the median marks obtained by the students of the class.


89 Views

Advertisement
269.

The marks obtained by 40 students of class X of a certain school in Science paper consisting of 10 marks are presented in the table below. Find the mean marks obtained by the students.

Marks obtained(xi)

5

6

7

8

9

Number of students (fi)

4

8

14

11

3

145 Views

270.

Consider the following distribution of daily wages of 50 workers of a factory.

Daily wages

100-120

120-140

140-160

160-180

180-200

No. of workers

12

14

8

6

10

Find the mean daily wages of the workers.

211 Views

Advertisement