Find mean, median and mode of the following data: Classes Fre

Previous Year Papers

Download Solved Question Papers Free for Offline Practice and view Solutions Online.

Test Series

Take Zigya Full and Sectional Test Series. Time it out for real assessment and get your results instantly.

Test Yourself

Practice and master your preparation for a specific topic or chapter. Check you scores at the end of the test.
Advertisement

 Multiple Choice QuestionsLong Answer Type

291.

A survey regarding the heights (in cm) of 50 girls of class X of a school was conducted and the following data was obtained:

Height in cm

120 - 130

130 - 140

140 - 150

150 - 160

160 - 170

Total

Number of girls

2

8

12

20

8

50

1558 Views

Advertisement

292.

Find mean, median and mode of the following data:

Classes

Frequency

0-20

6

20-40

8

40-60

10

60-80

12

80-100

6

100-120

5

120-140

3

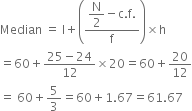
Median space equals space straight l plus open parentheses fraction numerator begin display style straight N over 2 end style minus straight c. straight f. over denominator straight f end fraction close parentheses cross times straight h
equals 60 plus fraction numerator 25 minus 24 over denominator 12 end fraction cross times 20 equals 60 plus 20 over 12
equals space 60 plus 5 over 3 equals 60 plus 1.67 equals 61.67


From the table,   I. Finding Mean:Now, 60 - 80 is the class whose c

From the table,   straight n equals sum for blank of straight f subscript straight i equals 50 rightwards double arrow straight n over 2 equals 25 comma space straight a space equals space 70 comma space straight h space equals space 20
I. Finding Mean:


Mean space equals space straight a space plus fraction numerator begin display style sum from blank to blank of end style straight u subscript straight i straight f subscript straight i over denominator begin display style sum from blank to blank of end style straight f subscript straight i end fraction cross times straight h equals 70 plus fraction numerator left parenthesis negative 19 right parenthesis over denominator 50 end fraction cross times 20
equals 70 minus 38 over 5 equals 70 minus 7.6 equals 62.4

Now, 60 - 80 is the class whose cumulative frequency 36 is greater than straight n over 2 equals 25.

Therefore, 60 - 80 is the median class. Thus, the lower limit (l) of the median class is 60.
Using the formula for calculating the median.
II. Finding median:  

Mode space equals space straight l plus open square brackets fraction numerator straight f subscript straight i straight f subscript 0 over denominator 2 straight f subscript 1 minus straight f subscript 0 minus straight f subscript 2 end fraction close square brackets cross times straight h
space space space space space space space space equals space 60 plus open square brackets fraction numerator 12 minus 10 over denominator 2 cross times 12 minus 10 minus 6 end fraction close square brackets cross times 20
space space space space space space space space equals space 60 equals fraction numerator 2 cross times 20 over denominator 24 minus 16 end fraction equals 60 plus 40 over 8
space space space

        = 60 + 5 = 65

642 Views

Advertisement
293.

Find mean, median and mode of the following data:

Classes

Frequency

0 - 50

2

50 - 100

3

100 - 150

5

150 - 200

6

200 - 250

5

250 - 300

3

300 - 350

1

977 Views

294.

 The following table gives the daily income of 50 workers of a factory :

Daily income (in Rs.)

No. of Workers

100-120

12

120-140

14

140-160

8

160-180

6

180-200

10

Find the Mean, Mode and Median of the above data.

1455 Views

Advertisement

 Multiple Choice QuestionsShort Answer Type

295.

Find the mode, median and mean for the following data :

Marks Obtained

Number of Students

25-35

7

35-45

31

45-55

33

55-65

17

65-75

11

75-85

1

197 Views

 Multiple Choice QuestionsLong Answer Type

296.

The table given below shows the frequency distribution of the scores obtained by 200 candidates in a BCA examination.

Score

No. of candidates

200-250

30

250-300

15

300-350

45

350-400

20

400-450

25

450-500

40

500-550

10

550-600

15

Draw cumulative frequency curves by using (i) 'less than series', (ii) 'more than series'.

409 Views

297.

Draw both types of cumulative freqneucy curve on the same graph paper and then determine the median.

Marks obtained

No. of students

50-60

4

60-70

8

70-80

12

80-90

6

90-100

6

190 Views

298.

Draw 'less than' and 'more than' ogive curve from the following and indicate the value of median.

Marks

No. of students (f)

0-5

7

5-10

10

10-15

20

15-20

13

20-25

12

25-30

10

30-35

14

35-40

9

2485 Views

Advertisement
299. The following table gives the daily income of 50 workers of a factory. Draw both types ("less than type" and "greater than type") ogives and determine the median of the data.

Daily Income (in Rs.)

Number of Workers

100-120

12

120-140

14

140-160

8

160-180

6

180-200

10

1338 Views

300.

During the medical check-up of 35 students of a class their weights were recorded as follows:

Weight (in kg.)

No. of Students

38—40

3

40—42

2

42—44

4

44—46

5

46—48

14

48—50

4

50—52

3

Draw a less than type and a more than type ogive from the given data. Hence obtain the median weight from the graph.

782 Views

Advertisement