 Long Answer Type
A survey regarding the heights (in cm) of 50 girls of class X of a school was conducted and the following data was obtained:
|
Height in cm |
120 - 130 |
130 - 140 |
140 - 150 |
150 - 160 |
160 - 170 |
Total |
|
Number of girls |
2 |
8 |
12 |
20 |
8 |
50 |
Find mean, median and mode of the following data:
|
Classes |
Frequency |
|
0-20 |
6 |
|
20-40 |
8 |
|
40-60 |
10 |
|
60-80 |
12 |
|
80-100 |
6 |
|
100-120 |
5 |
|
120-140 |
3 |

Find mean, median and mode of the following data:
|
Classes |
Frequency |
|
0 - 50 |
2 |
|
50 - 100 |
3 |
|
100 - 150 |
5 |
|
150 - 200 |
6 |
|
200 - 250 |
5 |
|
250 - 300 |
3 |
|
300 - 350 |
1 |
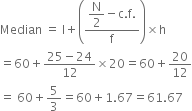
The following table gives the daily income of 50 workers of a factory :
|
Daily income (in Rs.) |
No. of Workers |
|
100-120 |
12 |
|
120-140 |
14 |
|
140-160 |
8 |
|
160-180 |
6 |
|
180-200 |
10 |
Find the Mean, Mode and Median of the above data.
 Short Answer Type
Find the mode, median and mean for the following data :
|
Marks Obtained |
Number of Students |
|
25-35 |
7 |
|
35-45 |
31 |
|
45-55 |
33 |
|
55-65 |
17 |
|
65-75 |
11 |
|
75-85 |
1 |
 Long Answer Type
The table given below shows the frequency distribution of the scores obtained by 200 candidates in a BCA examination.
|
Score |
No. of candidates |
|
200-250 |
30 |
|
250-300 |
15 |
|
300-350 |
45 |
|
350-400 |
20 |
|
400-450 |
25 |
|
450-500 |
40 |
|
500-550 |
10 |
|
550-600 |
15 |
Draw cumulative frequency curves by using (i) 'less than series', (ii) 'more than series'.
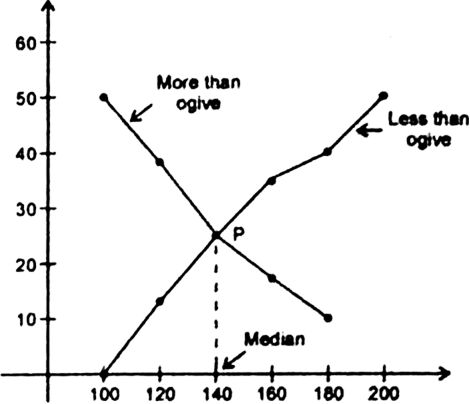
Draw both types of cumulative freqneucy curve on the same graph paper and then determine the median.
|
Marks obtained |
No. of students |
|
50-60 |
4 |
|
60-70 |
8 |
|
70-80 |
12 |
|
80-90 |
6 |
|
90-100 |
6 |
Draw 'less than' and 'more than' ogive curve from the following and indicate the value of median.
|
Marks |
No. of students (f) |
|
0-5 |
7 |
|
5-10 |
10 |
|
10-15 |
20 |
|
15-20 |
13 |
|
20-25 |
12 |
|
25-30 |
10 |
|
30-35 |
14 |
|
35-40 |
9 |
|
Daily Income (in Rs.) |
Number of Workers |
|
100-120 |
12 |
|
120-140 |
14 |
|
140-160 |
8 |
|
160-180 |
6 |
|
180-200 |
10 |
|
Marks |
No of students |
c.f. (Less than) |
c.f. (More than) |
|
100-120 |
12 |
12 |
50 |
|
120-140 |
14 |
26 |
38 |
|
140-160 |
8 |
34 |
24 |
|
160-180 |
6 |
40 |
16 |
|
180-200 |
10 |
50 |
10 |
No we plot the points (100, 0), (120, 12), (140, 26), (160, 34), (180, 40), (200, 50) for less than series. And (100, 50), (120, 38), (140, 24), (160,16), (180,10) for more than series.

During the medical check-up of 35 students of a class their weights were recorded as follows:
|
Weight (in kg.) |
No. of Students |
|
38—40 |
3 |
|
40—42 |
2 |
|
42—44 |
4 |
|
44—46 |
5 |
|
46—48 |
14 |
|
48—50 |
4 |
|
50—52 |
3 |
Draw a less than type and a more than type ogive from the given data. Hence obtain the median weight from the graph.
