If mean of the following data is 18.75, then the value of P is.

Previous Year Papers

Download Solved Question Papers Free for Offline Practice and view Solutions Online.

Test Series

Take Zigya Full and Sectional Test Series. Time it out for real assessment and get your results instantly.

Test Yourself

Practice and master your preparation for a specific topic or chapter. Check you scores at the end of the test.
Advertisement

 Multiple Choice QuestionsMultiple Choice Questions

401. A student draws a cumulative frequency came for the marks obtained by 40 students of a class as shown follow. The median marks obtained by the students of the class is


  • 40

  • 50

  • 54

  • 54

105 Views

402. Which measure of central tendency is given by the x-coordinate of the point of intersection of the 'more than ogive' and 'less than ogive'.
  • Mean  
  • Median 
  • Mode
  • Mode
1600 Views

403.

The value of the median of the graph in the given Fig. of less than ogive' and more than ogive is?
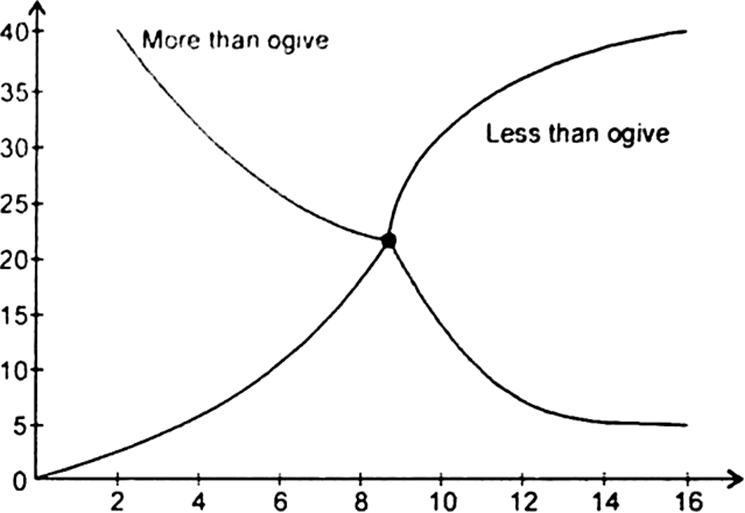
  • 5
  • 6

  • 7

  • 7

93 Views

404.

For what value of x, is the mode of the following data is 9 :
5, 8, 9, 3, 9, 8, 7, 6, 8, 9, x, 4

  • 5

  • 6

  • 7

  • 7

143 Views

Advertisement
Advertisement

405.

If mean of the following data is 18.75, then the value of P is.

xi

10

15

P

25

30

fi

5

10

7

8

2

  • 20

  • 25

  • 23

  • 23


A.

20

2492 Views

Advertisement
406.

The total marks (out of 500) of 12 students of a class are given below. The median of the data is : 450, 193, 350, 452, 497, 300, 478, 420, 357, 405, 412, 471

  • 416

  • 415

  • 417

  • 417

88 Views

407. The numbers 2, 3, 4, 2x + 1, 5, 5, 6, 7 are is ascending order. If median is 5, then the value of 'x' is
  • 3

  • 4

  • 2

  • 2

135 Views

408.

The mode of the following data i
120, 110, 120, 130, 120, 140, 130, 120, 140, 120

  • 110

  • 130

  • 120

  • 120

101 Views

Advertisement
409.

Calculate the median for the following :

Heights (cm)

120

121

122

123

124

125

No. of students

8

12

17

14

13

6

  • 120

  • 121

  • 123

  • 123

93 Views

410. What is the value of median of the data using the graph in figure, of less than ogive and more than ogive?


  • 4.5

  • 4

  • 5

  • 5

111 Views

Advertisement