 Multiple Choice Questions
Two species, M and N, occupy the same habitat. Given below is a 'state-space' graph in which the abundance of species M is plotted on the X-axis and abundance of species N is plotted on the Y-axis. For each species, the zero-growth isocline is plotted.
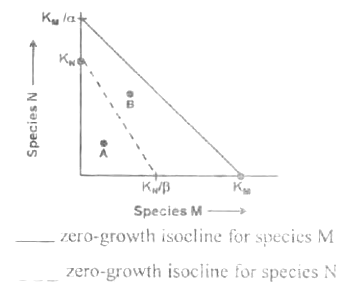
KM = carrying capacity of the habitat for species M in absence of species N.
KN = carrying capacity of the habitat for species N in absence of species M.
α = per capita effect of species N on M.
β = per capita effect os species M on N.
Based on the above plot some deductions are made. Which one of the following statements is incorrect?
At point A, populations of both the species M and N increase.
At point B, the population of species M increase while that of species N decreases.
At point B, the population of species N increases while that of species M decreases.
Ultimately species N will be eliminated.
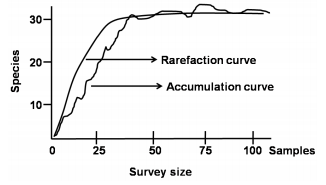
Given below are the species accumulation curves and rarefaction curves measured in an ecological community.
Which one of the following statements is INCORRECT about the two curves?
Species accumulation curve moves from left to right and rarefaction curve moves from right to left.
Species accumulation curve represents the total species richness of the assemblage.
Rarefaction curve represents the mean of repeated resampling of all pooled samples.
Rarefaction curve is the realized accumulation value of the total species in a community.
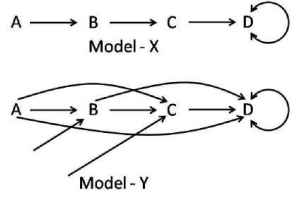
Given below are two patterns of ecological succession. Four species are represented by A, B, C, and D. An arrow indicates "is replaced by"
In the context of ecological succession, which of the following statements is INCORRECT with respect to the figures given above.
Model - X represents the facilitation model and Model - Y represents tolerance model
Model-X represents tolerance model and Model-Y represents inhibition model.
As per Model-Y, C can out-compete B but can also invade a habitat in their absence.
As per the Model - X, A makes the environments more suitable for B to invade.
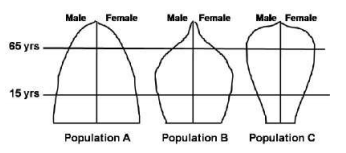
Given below are the population pyramids of three different populations A, B, and C depicting the relationship between birth and death rates in each.
Based on the population pyramids given above, which one of the following is INCORRECT?
Population B has a slower growth rate than population A.
Population C has birth rate higher than its death rate.
Population A represents a rapidly growing population.
Population B has the highest death rate among the three populations.
Three species M, N, and O when grown independently in a laboratory showed typical logistic growth curves. However, when grown in pairs, the following growth curves were observed.

What interpretation regarding the interspecific relationship between M, N, and O can be deduced from the above observations?
N predates over O and therefore can also predate on M.
N is competed out by M and O.
N and O possibly have a prey-predator relationship.
M and O exhibit prey-predator relationship.
Given below is an ecological pyramid.
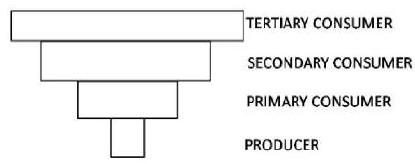
The above pyramid represents:
Pyramid of the number of a parasitic food chain and pyramid of biomass of a pond ecosystem.
Pyramid of number of a pond ecosystem and pyramid of biomass of a forest ecosystem.
Pyramid of energy of a grassland and pyramid of biomass of an open ocean ecosystem.
Pyramid of biomass of a grassland and pyramid of the number of a tropical forest ecosystem.
Given below are biodiversity hotspots in decreasing order of endemic plant species recorded in them. Select the correct order.
Western Ghats and Sri Lanka > Indo-Burma > Sundaland > Philippines
Philippines > Sundaland > Indo-Burma > Western Ghats and Sri Lanka
Sundaland > Indo-Burma > Philippines > Western Ghats and Sri Lanka
Western Ghats and Sri Lanka > Sundaland > Philippines > Indo-Burma
Which of the following options lists ecosystems in increasing order of plant productivity per day per unit leaf area?
Tropical forests, hot deserts, temperate forests
Hot deserts, temperate forests, tropical forests
Hot deserts, temperate grasslands, tropical forests
Tropical forests, temperate grasslands, hot deserts
A general increase in the average body mass of animal population within a species with latitude is known as
Allen’s rule
Bergmann’s rule
Allec effect
Hamilton’s rule
Ruderal species are those which are found in the environments with
low disturbance, high competition
high disturbance, low competition
low disturbance, low competition
high disturbance, high competition
