 Multiple Choice Questions
Which one of the following is the most appropriate match for the protected areas of India?
| Category | Protected Area |
| A. Biosphere Reserve | (i) Chambal |
| B. National Park | (ii) Loktak |
| C. Ramsar site | (iii) Nanda Devi |
| D. Wildlife Sanctuary | (iv) Rajaji |
| (v) Sunderbans |
A - (iii); B - (iv); C - (ii); D - (i)
A - (ii); B - (iv); C - (iii); D - (i)
A - (iv); B - (ii); C - (v); D - (iv)
A - (iii); B - (ii); C - (v); D - (iv)
Two lakes (I and II) with a similar trophic structure of phytoplankton-zooplankton-planktivorous fish food chain were chosen. To understand the 'top-down' effects, some piscivorous fish (those that feed on planktivorous fish) were introduced into Lake I, making it a system with four trophic levels. Lake II was enriched by adding large quantities of nitrates and phosphates to study the 'bottom-up' effects over a period of time. Changes in the biomasses of each trophic level were measured. The expected major changes in the two lakes are
In Lake I zooplankton biomass increases, phytoplankton biomass decreases.
In Lake II both phytoplankton and planktivorous fish biomasses increase.
In Lake I zooplankton biomass decrease, phytoplankton biomass increases.
In Lake II both phytoplankton and planktivorous fish biomasses increase.
In Lake I planktivorous fish biomass and phytoplankton biomass decrease.
In Lake II phytoplankton biomass increases, planktivorous fish biomass decreases.
In Lake I planktivorous fish and zooplankton biomasses increase.
In Lake II both phytoplankton and planktivorous fish biomasses increase.
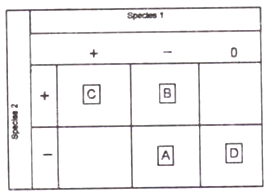
Given below is a matrix of possible interactions (beneficial (+), harmful (-), neutral (0)) between species 1 and 2. The names of interactions, A, B, C, and D respectively are

Predation, competition, mutualsim, commensalism
Mutualism, Competition, amensalism, commensalism
Competition, Predation, mutualism, amensalism
Competition, mutualism, commensalism, predation
Which of the following is/are NOT valid explanation(s) for the observed pattern of species richness?
A. Older communities are more species-rich.
B. LArge areas support more species.
C. Natural enemies promote reduced species richness at local level.
D. Communities in climatically habitats may themselves be similar in species richness.
E. Greater productivity permits existence of more species.
B, C and D
Only C
Only D
A, B and E
The following table shows the number of individuals of each species found in two communities:
| Community | Species A | Species B | Species C | Species D |
| C1 | 25 | 25 | 25 | 25 |
| C2 | 80 | 05 | 05 | 10 |
(Hint: ln value for 0.05, 0.10, 0.25 and 0.80 are -3.0, -2.3, -1.4 and -0.2, respectively)
The calculated Shannon diversity index (H) value for communities C1 and C2, respectively, are
1.4 and 0.69
1.2 and 0.34
2.1 and 0.43
1.8 and 0.37
Following are the main types of defense employed by prey species against predators.
Types of defense : Chemical with aposematic coloration (A); Cryptic coloration (B); Batesian mimicry (C); Intimidation display (D)
Prey species : Grasshoppers and seahorses (i); Hoverflies and wasps (ii); Bombardier battles, ladybird beetles, many butterflies (iii); Frilled lizard, Porcupine fish (iv)
Which on of the following combinations is correct?
A - (i);B - (iii); C - (ii); D - (iv)
A - (iv);B - (ii); C - (i); D - (iii)
A - (iii);B - (i); C - (ii); D - (iv)
A - (ii);B - (iii); C - (i); D - (iv)
In a population of effective population size Ne, with rate of neutral mutation μ0, the frequency of heterozygotes per nucleotide site at equilibrium between mutation and genetic drift is calculated as
B.
In a population of effective population size Ne, with rate of neutral mutation μ0, the frequency of heterozygotes per nucleotide site at equilibrium between mutation and genetic drift is calculated as-
Following table shows the presence (+) or absence (-) of five species in three communities (A, B, C):
| Species | Community A | Community B | Community C |
| 1 | + | + | + |
| 2 | + | + | - |
| 3 | - | - | + |
| 4 | + | - | - |
| 5 | - | - | + |
Based on the above, which of the following is the correct order of similarity between two pairs of communities?
A and B > B and C > A and C
A and B > A and C > B and C
B and C > A and B > A and C
A and C > A and B > B and C
Following table shows the number of individuals of five tree species in a community:
| Tree species | No. of individuals |
| A | 50 |
| B | 20 |
| C | 20 |
| D | 05 |
| E | 05 |
Based on the above, the Simpson's diversity (DS) Index of the community will be
0.552
0.335
0.435
0.345
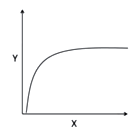
Which of the following X-Y relationships does NOT follow the pattern shown in the graph?

Number of prey killed (Y) in relation to prey density (X).
Photosynthetic rate (Y) in relation to light intensity (X).
Species richness (Y) in relation to area (X).
Tree species richness (Y) in relation to actual evapotranspiration.
