 Multiple Choice Questions
In a field experiment, autotrophs are provided a 14C-labelled carbon compound for photosynthesis. Radioactivity (14C) levels were then monitored at regular intervals in all the trophic levels. In which ecosystem is the radioactivity likely to be detected fastest at the primary carnivore level?
Open ocean
Desert
Deciduous forest
Grassland
A population is growing logistically with a growth rate (r) of 0.15/week, in an environment with a carrying capacity of 400. What is the maximum growth rate (No. of individuals/ week) that this population can achieve?
15
30
22.5
60
Important chemical reactions involved in nutrient cycling in ecosystems are given below:
a. NO
b. N2 → NH3
c. NH
d. NO → N2
The organisms associated with these chemical reactions are
a - Nitrosomonas; b - Pseudomonas; c - Nostoc; d - Nitrobacter
a - Pseudomonas; b - Nitrobacter; c - Nostoc; d - Nitrosomonas
a - Nitrobacter; b - Nostoc; c - Nitrosomonas; d - Pseudomonas
a - Nostoc; b - Nitrosomonas; c - Nitrobacter; d - Pseudomonas
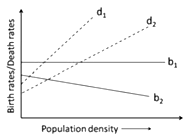
Which of the following statements about the birth rates (b1, b2) and death rates (d1, d2) of species 1 and 2 indicated in the figure is NOT true?

Birth rates of species 1 are density-independent.
Death rates of both species are density-dependent.
Birth rates of species 2 are density-dependent.
Density-dependent effects on death rates are similar for both the species.
A red coloured tubular flower without any odour is most likely to be pollinated by
beetles
bees
butterflies
birds
Which gas does NOT contribute to global warming through its greenhouse effect?
Nitrous oxide
Methane
Carbon dioxide
Nitric oxide
In the following equations
(a) dN/ dt = rN
(b) Nt = N0ert
(c) dN/ dt = rN
(d) dN/ dt = rN × N/K
exponential population growth is described by
a and b
a only
c only
b and d
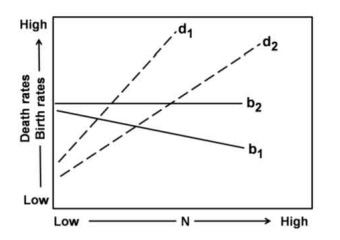
The birth rates (b) and death rates (d) of two species 1 and 2 in relation to population density (N) are shown in the graph. Which of the following is NOT true about the density-dependent effects on birth rates and death rates?

Birth rates are density-dependent in species 1 and density-independent in species 2.
Death rates are density-dependent in both the species.
The density-dependent effect on the birth rate is stronger in species 1 than in species 2.
The density-dependent effects on death rates are similar in both the species.
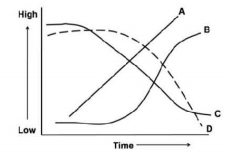
In a lake subjected to progressive eutrophication, temporal changes in the magnitude of selected parameters (A, B, C, D) are shown in the graph

The parameters A, B, C, D are
A - Green algal biomass; B - Cyanobacterial biomass; C - dissolved oxygen concentration; D - Biological Oxygen Demand
A - Biological Oxygen Demand; B - Cyanobacterial biomass; C - Dissolved oxygen concentration; D - Green algal biomass
A - Biological oxygen demand; B - Green algal biomass; C - Cyanobacterial biomass; D - Dissolved oxygen concentration
A - Cyanobacterial biomass; B - Biological oxygen demand; C - Green algal biomass; D - Dissolved oxygen concentration
B.
A - Biological Oxygen Demand; B - Cyanobacterial biomass; C - Dissolved oxygen concentration; D - Green algal biomass
The parameters A, B, C, and D are-
A - Biological Oxygen Demand; B - Cyanobacterial biomass; C - Dissolved oxygen concentration; D - Green algal biomass
The approximate P: B (Net Primary Production: Biomass) ratios in four different ecosystems A, B, C, D) are:
A - 0.29; B - 0.042; C - 16.48; D - 8.2
The four ecosystems are
A - Ocean; B - Lake; C - Grassland; D - Tropical forest
A - Grassland; B - Tropical forest; C - Ocean; D - Lake
A - Tropical forest; B - Ocean; C - Grassland; D - Lake
A - Grassland; B - Ocean; C - Lake; D - Tropical forest
