 Multiple Choice Questions
What is the significance of upwelling zone for marine ecosystems?
It is responsible for uniformity of temperature in ocean to support the marine life
It brings nutrients from deeper zones to relatively nutrient poor oceans surface thus increasing marine producity.
It is responsible for uniform oxygenation of marine waters thus increasing marine productivity
It helps in circulating decomposers from the bottom of ocean to surface for proper decomposition of dead material on the surface
Given below in column A are schematic representation of three types of pairwise species interaction and the name of some interaction are in column B

Select the best match for interaction between column A and B in each schematic figure.
A-(iii), B-(ii), C-(iv)
A-(iv), B-(ii), C-(iii)
A-(ii), B-(iv), C-(i)
A-(iii), B-(i), C-(ii)
C.
A-(ii), B-(iv), C-(i)
Option (c) is correct.
Choose the correct answer from the statements indicate below
Chi square test is parametric
Non-parametric test assumes normal distribution
Result can be significantly affected by outlier in a parametric test.
Non-parametric test is more powerful as compared to parametric test.
Given below are names of statistical distribution (column I) and their characteristic features (column II)
| Column I | Column II |
| (a) Binomial distribution | (i) each observation represents one of two outcomes (success or failure) |
| (b) Poisson distribution | (ii) Probability distribution that is symmetric about the mean |
| (c) Normal distribution | (iii) Probability of a given number of events happening in a fixed interval timing. |
Which one of the following represents a correct match between columns I and II?
| (a) | (b) | (c) |
| (ii) | (i) | (iii) |
| (a) | (b) | (c) |
| (i) | (ii) | (iii) |
| (a) | (b) | (c) |
| (i) | (iii) | (ii) |
| (a) | (b) | (c) |
| (iii) | (ii) | (i) |
In the following table, a list of threat categories and animals of India is given in an alphabeticl order:
| Animals | Threat category |
| (i) Bengal Florican | (a) Critically endangered |
| (ii) Ganga River Dolphin | (b) Endangered |
| (iii) Indian Rhinoceros | (c) Vulnerable |
| (iv) Indian Vulture |
Which of the following options show correct combination of animals and their threat category as per Red Data list of IUCN?
| (i) | (ii) | (iii) | (iv) |
| (a) | (d) | (b) | (c) |
| (i) | (ii) | (iii) | (iv) |
| (a) | (b) | (c) | (d) |
| (i) | (ii) | (iii) | (iv) |
| (b) | (c) | (b) | (a) |
| (i) | (ii) | (iii) | (iv) |
| (c) | (a) | (d) | (b) |
Following table shows an alphabetical list of certain domesticated crops and placed of origin:
| Crop | Place of orgin |
| (i) Barley | (a) China |
| (ii) Mazie | (b) Fertile Crescent |
| (iii) Mung Bean | (c) India |
| (iv) Rice | (d) Southern Mexico |
| (v) wheat |
Based on the above, which one of the following options represent the correct match between crops and their place of origin?
(i)-(c),(ii)-(d),(iii)-(a),(iv)-(b),(v)-(b)
(i)-(d),(ii)-(b),(iii)-(a),(iv)-(a),(v)-(b)
(i)-(c),(ii)-(d),(iii)-(c),(iv)-(b),(v)-(c)
(i)-(b),(ii)-(d),(iii)-(c),(iv)-(a),(v)-(b)
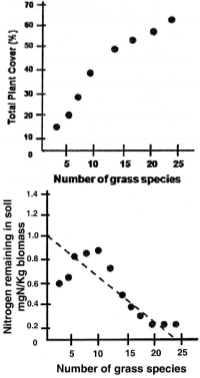
Grassland plots with varying number of grass species were cultivated for 10 years. At the end of the experiment, total plant cover was measured. Soil nitrogen was also measured to assess its utilization by plants. The relationship are shown in the following plot.

Which one of the following inferences can be drawn from the above experiments?
Grasses in the plots with lower species richness enriched soil nitrogen, thereby increasing the plant cover
Plots with greater species richness showed greater stability and more efficient soil nitrigen utilization.
Plots with greater species richness utilized nitrogen more efficiently, but would not show increased net primary production
No correlation can be drawn between species richness, community productivity and nitrogen utilization
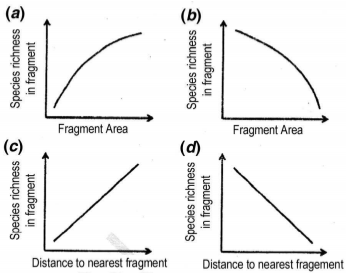
Forest Fragments in an agriculture landscape can be viewed as islands of habitat in an ocean of non-habita. MacArthur and Wilson's isalnd biogeography model can be used to predict pattern of species richness in these forest fragments which are represented in the graphs below.

Which one of the following combinations of the graphs correctly represents predictions from the model?
(a) and (c)
(a) and (d)
(b) and (c)
(b) and (d)
In order to estimate population size of a fish species in a lake, researcher capture 100 fish from the lake and marks them with colored tags. A week later, the researcher returns to the lake and catches 150 fish of the same species and finds that 25 of them are previously tagged ones. Assuming no immigration or emigration occurred, the total population size of the fish species in the lake will be:
17
38
600
860
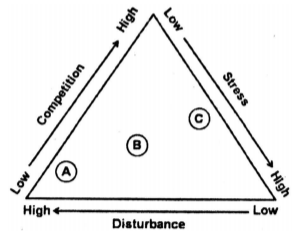
Given below is graphical representation of plant life histories based on Grime's model in which stress, disturbance and competition are important factors.

which of the following options correctly represents A,B and C respectively in the figure above?
perennial herbs, tree and shrubs, annual plants
annual plants, perennial herbs, trees and shrubs
annual plants, trees and shrubs, perennial herbs
trees and shrubs, perennial herbs, annual plants
