 Multiple Choice Questions
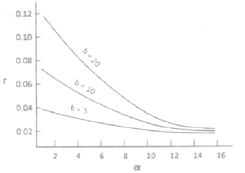
The graph below shows the relationships of per capita population growth rate (r), fecundity (b) and age at first reproduction (α) in an animal species What is the most important conclusion to be drawn from the graph?

The later the age of first reproduction, the lower is the population growth rate achieved
The population growth rate decreases as first reproduction is postponed to a later stage, regardless of the fecundity
At any α, the higher the fecundity, the higher is the population growth rate achieved
As the age at first reproduction is postponed further, the benefits of increasing fecundity on the population growth rate become progressively negligible.
The first living beings on earth were anaerobic because
There was no oxygen in air
Oxygen damages proteins
Oxygen interferes with the action of ribozymes
They evolved in deep sea
The peacock’s tail is an example of
Natural selection
Diversifying selection
Sexual selection
Group selection
A specialist species has a
Wider niche and high efficiency of niche utilization
Narrower niche and high efficiency of niche utilization
Wider niche and low efficiency of niche utilization
Narrower niche and low efficiency of niche utilization
Identify the synapomorphies in the following cladogram:

(a) Seeds with long terminal wing; (b) ovules 1-20 per scale; (c) resin canals; (d) 1 ovule per scale
(a)resin canals; (b) seeds with long terminal wing (c) 1 ovule per scale; (d) ovules 1-20 per scale
(a)resin canals; (b) ovules 1-20 per scale; (c) seeds with long terminal wing; (d) 1 ovule per scale
(a) seeds with long terminal wing; (b) ovules 1-20 per scale; (c) 1 ovule per scale; (d) resin canals
From among the five animals listed below, match the two attributes-amniotic egg and endothermy, with the correct animal (s):
(a)Fish (b)Frog (c)Crocodile (d)Pigeon (e)Zebra
Amniotic egg: b, c, d; Endothermy: d, e
Amniotic egg: c, d, e; Endothermy: d, e
Amniotic egg: a, b, c, d; Endothermy: c, d, e
Amniotic egg: b, c, d; Endothermy: c, d, e
Several distinct time periods and different routes might eplain the entrance of marsupials into Australia
(i) Late Jurassic – early therians arrived in Antarctica –Australia where the marsupials subsequently evolved
(ii) Early to middle Cretaceus – early marsupials arrived in Australia from northern regions and then radiated in isolation.
(iii) Paleocene – marsupials entered Australia from south-East Asia.
(iv) Eocene – chance dispersal of marsupials into Australia.
Which of the following is the correct combination?
(i) (ii) (iii)
(i) (iii) (iv)
(ii) (iii) (iv)
(i) (ii) (iv)
The frequencies of two alleles p and q for a gene locus in a population at Hardy-Weinberg equilibrium are 0.3 and 0.7, respectively. After a few generations of inbreeding, the heterozygote frequency was found to be 0.28. The inbreeding coefficient in this case is
0.42
0.28
0.33
0.67
Number of trials required for rats to learn a task when they were exposed to various condition were as follows:
| Experimental conditions | Observations |
|
A. Light: light dark cycle – 12h: 12h |
N – trials |
| B. Bright light – 24 h |
Significantly more trials than ‘N’ |
| C. Bright light – 24 h + continuous physical disturbance |
Significantly more trials than ‘N’ |
| D. Dark light – 24 h + continuous physical disturbance |
Significantly more trials than ‘N’ |
Which of the following inferences is most appropriate?
Continuous light enhanced learning
Continuous darkness inhibited learning
Physical activity inhibited learning
Learning was reduced by sleep loss
Assume a male sparrow (species X) is hatched and reared in isolation and allowed a critical imprinting period to hear the song of a male of another sparrow (species Y). Now after the isolation, what kind of behavior will species X show?
It will sing the sing of species Y that it had heard in the critical period.
It will sing the song of its own species X.
It will not sing at all.
It will sing a song not sung by either X or Y.
