 Multiple Choice Questions
When a body is earth connected, electrons from the earth flow into the body. This means the body is
charged negatively
an insulator
uncharged
charged positively
The electron in a hydrogen atom makes a transition from n = n1 to n = n2 state. The time period of the electron in the initial state (n1) is eight times that in the final state (n2). The possible values of n1 and n2 are
n1 = 8, n2 = 1
n1 = 4, n2 = 2
n1 = 2, n2 = 4
n1 = 1, n2 = 8
The energy that should be added to an electron to reduce its de-Broglie wavelength from 1 nm to 0.5 nm is
four times the initial energy
equal to the initial energy
twice the initial energy
thrice the initial energy
Bohr's atom model assumes
the nucleus is of infinite mass and is at rest
electrons in a quantized orbit will not radiate energy
mass of electron remains constant
all the above conditions
White light is passed through a dilute solution of potassium permanganate. The specturm produced by the emergent light is
band emission spectrum
line emission spectrum
band absorption spectrum
line absorption spectrum
If λ1 and λ2 are the wavelengths of the first members of the Lyman and Paschen series respectively, then λ1 : λ2 , is
1 : 3
1 : 30
7 : 50
7 : 108
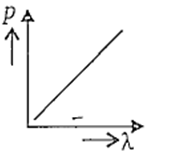
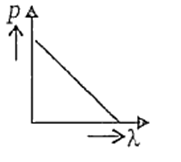
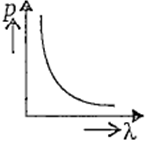
Which of the following figures represents the variation of particle momentum and associated de-Broglie wavelength ?


D.

de-Broglie wavelength
Hence, the graph between λ and p will be a rectangular hyperbola.
Electrons in a certain energy level n = n1 can emit 3 spectral lines. When they are in another energy level, n = n2, they can emit 6 spectral lines. The orbital speed of the electrons in the orbits are in the ratio
4 : 3
3 : 4
2 : 1
1 : 2
The de-Broglie wavelength of a proton (charge = 1.6 x 10⁻¹⁹ C, mass = 16 x 10-27 kg) accelerated through a potential difference of 1 kV is
0.9 nm
In Raman effect, Stokes' lines are spectral lines having
frequency greater than that of the original line
wavelength equal to that of the original line
wavelength less than that of the original line
wavelength greater than that of the original line
