 Multiple Choice Questions
The following pie-chart shows proportion of population of seven villages in 2009. Study the pie-chart and answer the questions that follow:
If the below poverty line population of the village 'X' is 12160, then the population of village 'S' is
18500
20500
22000
20000
The following pie-chart shows proportion of population of seven villages in 2009. Study the pie-chart and answer the questions that follow:
The ratio of the below poverty line population of village 'T' to that of the below poverty line population of village 'Z' is
11 : 23
13 : 11
23 : 11
11 : 13
C.
23 : 11
Let x be the total population of all the seven villages.
Population of village T below poverty line

Population of village Z below poverty line

∴ Required ratio:

The following pie-chart shows proportion of population of seven villages in 2009. Study the pie-chart and answer the questions that follow:
If the population of the village 'R' is 32000, then the below poverty line population of village 'Y' is:
14100
15600
16500
17000
The following pie-chart shows proportion of population of seven villages in 2009. Study the pie-chart and answer the questions that follow:
In 2010, the population of 'Y" and 'V' increases by 10% each and the percentage of population below poverty line remains unchanged for all the villages. If in 2009, the population of village Y was 30000, then the below poverty line population of village 'V' in 2010 is ...............
11250
12760
13140
13780
The pie-chart given here shows monthly expenses on various heads and savings of the family of Mr.Rao Study the chart and answer the questions based on it.
The amount spent on food exceeds the total amount spent on education and clothing by:

25%

50%
The pie-chart given here shows monthly expenses on various heads and savings of the family of Mr.Rao Study the chart and answer the questions based on it.
What percent of his income does Mr. Rao save?
25%
30%

36%
The pie-chart given here shows monthly expenses on various heads and savings of the family of Mr.Rao Study the chart and answer the questions based on it.
If the total income of Mr. Rao is Rs. 72,000, how much house rent does he pay?
Rs. 5,400
Rs. 9,000
Rs. 10,800
Rs. 12,000
The pie-chart given here shows monthly expenses on various heads and savings of the family of Mr.Rao Study the chart and answer the questions based on it.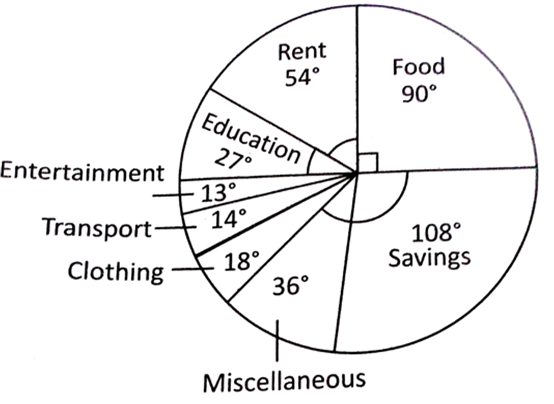
What percent of his income, does Mr. Rao spend on clothing, transport and entertainment combined together?

27%
25%

The pie chart drawn below shows the spendings of a country on various sports during a particular year. Study the pie-chart and answer the questions.
The ratio of the amount spent on football, basketball and cricket to that spent on tennis, hockey and golf is:
5 : 7
7 : 5
15 : 1
3 : 20
The pie chart drawn below shows the spendings of a country on various sports during a particular year. Study the pie-chart and answer the questions.
If the total amount spent on sports during the year was Rs 1,20,00,000/-, how much was spent on basketball?
Rs 9,50,000
Rs 10,00,000
Rs 12,00,000
Rs 15,00,000


 Switch


