 Multiple Choice Questions
|
LIST I (Instruments) |
LIST II (Measured Entity) |
| (a) Sling Psychrometer | (i) Soil Density |
| (b) Pedometer | (ii) Radiant Energy |
| (C) Spectrometer | (iii) Relative Humidity |
| (d) Pycnometer | (iv) Distance |
(a)-(iii) , (b)-(iv) , (c)-(i) , (d)-(ii)
(a)-(iii) , (b)-(iv) , (c)-(ii) , (d)-(i)
(a)-(iv) , (b)-(iii) , (c)-(ii) , (d)-(i)
(a)-(i) , (b)-(ii) , (c)-(iv) , (d)-(iii)
A set of sample of 20 places of mean annual rainfall were randomly selected from a normally distributed universe that has mean annual rainfall of 320cm. The sample mean was recorded 250cm with standard deviation of 150cm. Which one of the following significance tests is correct for the selected samples ?
Z test
x2 test
F test
t test
ASSERTION (A) : Radars are considered as active sensors.
REASON (R) : These sensors detect objects and their ranges using radio waves.
Both (A) and (R) are true and (R) is correct explanation of (A)
Both (A) and (R) are true , and (R) is not the correct explannation of (A).
(A) is true but (R) is false.
(A) is false but (R) is true.
Which on eof the following is the correct sequences of various EMR spectrum bands in the ascending order of wavelength ?
Blue-Green-Red-Ultraviolet
Red-Blue-Green-Ultraviolet
Ultraviolet-Blue-Green-Red
Ultraviolet-Green-Blue-Red
Which on of the following organisations looks after the receiving and processing of remote sensing data in India ?
SHAR Centre
SDS Centre
LPS Centre
NRSC
|
LIST I (Map type) |
LIST II (Information Content) |
| (a) Chorochromatic | (i) showing regional variation in distribution by shades |
| (b) Choroschematic | (ii) areal distribution by Tints |
| (c) Choropleth | (iii) showing imaginary lines joining places of equal value |
| (d) Isopleth | (iv) areal distribution by symbols |
(a)-(i) , (b)-(iv) , (c)-(ii) , (d)-(iii)
(a)-(iv) , (b)-(i) , (c)-(iii) , (d)-(ii)
(a)-(iv) , (b)-(ii) , (c)-(iii) , (d)-(i)
Choose the correct answer using the codes given below :
STATEMENTS :
(a) Summation of ranks method is quite simple and highly skewed.
(b) Summation of ranks method is quite simple and easy to handle.
(c) Z-score method is the robust and most reliable among all the methods used to measure levels of development.
(d) Use of Principal Component Analysis method should be avoided if inter-correlation among different components of developments weak or doubtful.
(a), (b) and (c) are correct.
(a) and (b) are correct.
(a) , (b) and (d) are correct.
(b) and (d) are correct.
On a topographical map of 1:50000 scale the contour interval is given as 10 metres. Place A is situated on a contour of 200m MSL and another B is located on a contour of 240m MSL . The distance between A and B on the map is 4cms. The correct gradient between A and B therefore would be :
1/30
1/40
1/50
1/60
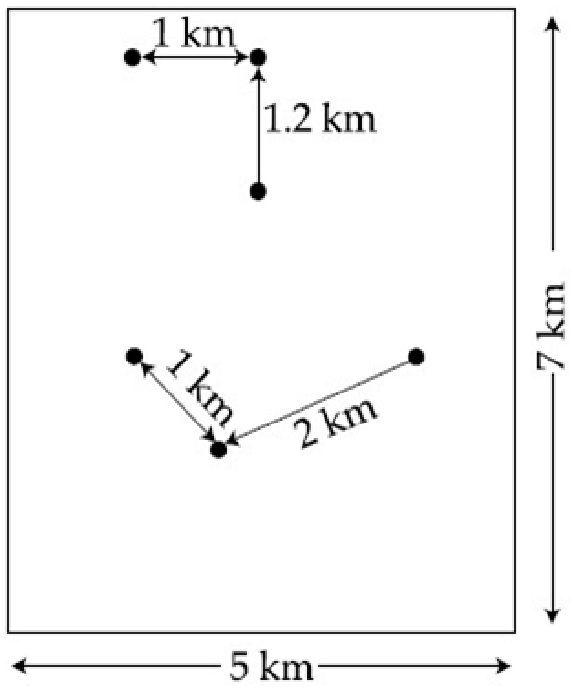
Which on of the following codes is correc Rn value of the given distribution of 6 settlement of an area of gentle topography ?

0.95
1.45
1.63
1.86
A.
0.95
In a frequnecy distribution of X series having 6integers with missing one , Xi , among them , the parameters of calculating mean , X͞ are as ∑ƒx = 370 (excluding frequency of missing Xi which is ƒi = 10) , ∑ƒ = 58 (excluding frequency of the missing integer) and X͞ =7.586 . Which one of the following integers is approximately correct for missing Xi ?
6
7
8
9
