 Short Answer Type
 Long Answer Type
How will you represent the Boyle's law graphically in different ways?
This law can be represented in three ways:
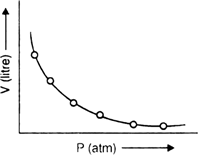
(i) Graph between P (pressure) and V (volume):
If a graph is plotted between P and V of gas at a particular temperature, a curve of the form of the regular hyperbola is obtained. This shows that volume is inversely proportional to pressure.
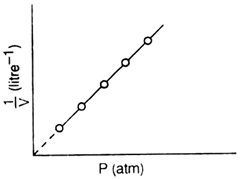
(ii) Graph between P (pressure) and  : (1/volume):
If a graph is plotted between P and 
a straight line is obtained which shows that pressure and volume are inversely related to each other.
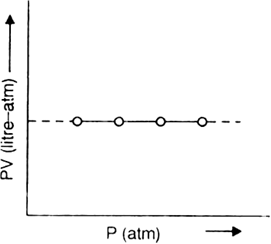
(iii) Graph between P(pressure) and PV (Product of pressure and volume):
If a graph is plotted between P and PV, a horizontal straight line is obtained. This illustrates the relationship
PV = constant.
These curves plotted at particular temperature are known as isotherms.
 Short Answer Type
A weather balloon has a volume of 175 L when filled with hydrogen at a pressure of 1.00 bars. Calculate the volume of the balloon when it rises to a height of 2000m, where the atmospheric pressure is 0.80 bar. Assume that the temperature is constant ?
A balloon is filled with hydrogen at room temperature. It will burst if the pressure exceeds 0.2 bar. If at 1 bar pressure, the gas occupies 2.27 L volume, up to what volume can the balloon be expanded?
What will be the minimum pressure required to compress 500 dm3 of air at 1 bar to 200 dm3 at 30C?
 Long Answer Type
A vessel of 120 mL capacity contains a certain amount of gas at 35°C and 1·2 bar pressure. The gas is transferred to another vessel of volume 180 mL at 35°C. What would be its pressure ?
 Short Answer Type
A gas occupies a volume of 300 mL at 740 mm Hg at 20°C. What additional pressure is required to reduce the gas volume to 250 ml at 20°C?
What pressure must be applied to a given sample of a gas in order to compress it to three-fourth of its original volume ?
