 Short Answer Type
Draw graph of the following linear equations on the same axes
(i) x + y = 3
(ii) 3x – 2y = 4
Also shade the region formed by their graphs and y-axis.
 Long Answer TypeShort Answer Type
 Check from the graph that (7, 5) is a solution of the linear equation.

Table of solutions
|
x |
1 |
4 |
|
y |
1 |
3 |
We plot the points (1,1) and (4, 3) on a graph paper and join the same by a ruler to get the line which is the graph of the equation 
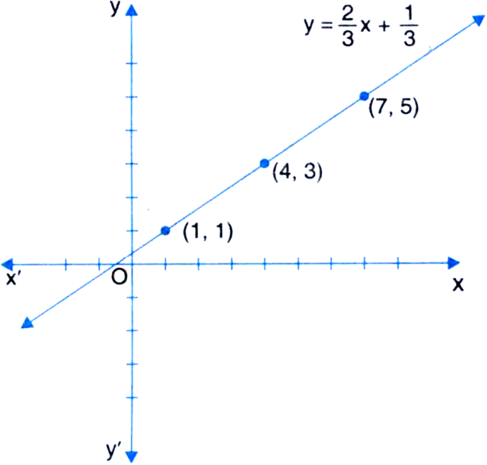
From graph, we see that the point (7, 5) lies on the graph, so it is a solution of the linear equation.


 Switch


