 Short Answer Type
The following table gives the distribution of the life-time of 400 new lamps.
|
Life-time (hrs.) |
No. of lamps |
|
1500-2000 |
14 |
|
2000-2500 |
56 |
|
2500-3000 |
60 |
|
3000-3500 |
86 |
|
3500-4000 |
74 |
|
4000-4500 |
62 |
|
4500-5000 |
48 |
100 surnames were randomly picked up from a local telephone directory and the frequency distribution of the number of letters in the English alphabets in the surnames was obtained as follows:
|
Number of letters |
1-4 |
4-7 |
7-10 |
10-13 |
13-16 |
16-19 |
|
Number of surnames |
6 |
30 |
40 |
16 |
4 |
4 |
Determine the median number of letters in the surnames. Find the mean number of letters in the surnames? Also, find the modal size of the surnames.
The distribution below gives the weights of 30 students of a class. Find the Median weight of the students.
|
Weight (in k.g) |
40-45 |
45-50 |
50-55 |
55-60 |
60-65 |
65-70 |
70-75 |
|
No. of students (f) |
2 |
3 |
8 |
6 |
6 |
3 |
2 |
The following distribution gives the daily income of 50 workers of a factory.
|
Daily income (in Rs.) |
100-120 |
120-140 |
140-160 |
160-180 |
180-200 |
|
Number of workers |
12 |
14 |
8 |
6 |
10 |
Convert the distribution above to a less than type cumulative frequency distribution, and draw its ogive.
 Long Answer Type
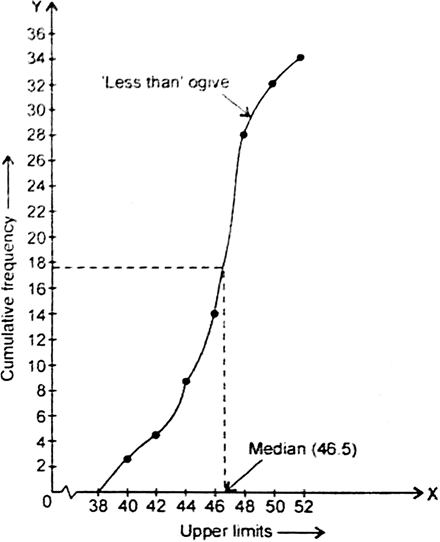
Durine the medical check-up of 35 students of a class, their weight were recorded as follows:
|
Weight (in kg) |
Number of students |
|
Less than 38 |
0 |
|
Less than 40 |
3 |
|
Less than 42 |
5 |
|
Less than 44 |
9 |
|
Less than 46 |
14 |
|
Less than 48 |
28 |
|
Less than 50 |
32 |
|
Less than 52 |
35 |
During a less than type ogive for the given data. Hence obtain the median weight from the graph - and verify the result by using the formula.
Here, ![]()
Locatae 17.5 on the y-axis. From this point, draw a line parallel to the x-axis cutting the curve at a point. From this point, draw a perpendicular to the x-axis. The point of intersection of this perpendicular with the x-axis determines the median of the given data as 46.5 kg.
Median weight by using the formula :
|
Weight (in k.g) |
No. of students |
Cumulative frequency |
|
0-38 |
0 |
0 |
|
38-40 |
3 |
3 |
|
40-42 |
2 |
5 |
|
42-44 |
4 |
9 |
|
44-46 |
5 |
14 |
|
46-48 |
14 |
28 |
|
48-50 |
4 |
32 |
|
50-52 |
3 |
35 |
|
n = 35 |

We have n = 35. So ![]() th observation = 17.5th observation.
th observation = 17.5th observation.
So, median lies in the group of 46-48 i.e.Median class = 46-48
Now, we have Median class = 46 -48 Short Answer Type
The following table gives production yield per hectare of wheat of 100 farms of a village.
|
Production yield (in kg/ha) |
50-55 |
55-60 |
60-65 |
65-70 |
70-75 |
75-80 |
|
Number of farms |
2 |
8 |
12 |
24 |
38 |
16 |
Change the distribution to a more than type distribution and draw its ogive.


