 Short Answer Type
Find the mode of the distribution from the following data.
|
Class |
Frequcncy |
|
10-15 |
3 |
|
15-20 |
2 |
|
20-25 |
10 |
|
25-30 |
7 |
|
30-35 |
20 |
|
35-40 |
5 |
|
40-45 |
8 |
Determine the value of mode from the following frequency distribution table.
|
Murks (C.I.) |
No. of students (f) |
|
0-10 |
5 |
|
10-20 |
12 |
|
20-30 |
14 |
|
30-40 |
10 |
|
40-50 |
8 |
|
50-60 |
6 |
 Long Answer Type
The marks distribution of 30 students in a mathematics are given in the table. Find the mode of this data. Also compare and interpret the mode and mean.
|
Class interval |
Number of students (f) |
|
10-25 |
2 |
|
25-40 |
3 |
|
40-55 |
7 |
|
55-70 |
6 |
|
70-85 |
6 |
|
85-100 |
6 |
 Short Answer Type
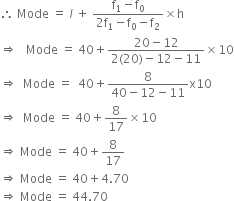
The following table shows the marks obtained by 100 students of class X in a school during a particular academic session. Find the mode of this distribution.
|
Marks |
No. of students |
|
Less than 10 |
7 |
|
Less than 20 |
21 |
|
Less than 30 |
34 |
|
Less than 40 |
46 |
|
Less than 50 |
66 |
|
Less than 60 |
77 |
|
Less than 70 |
92 |
|
Less than 80 |
100 |
|
Class Marks (C.I.) |
No. of students (c.f.) |
f |
|
Less than 10 |
7 |
7 |
|
Less than 20 |
21 |
14 |
|
Less than 30 |
34 |
13 |
|
Less than 40 |
46 |
12 |
|
Less than 50 |
66 |
20 |
|
Less than 60 |
77 |
11 |
|
Less than 70 |
92 |
15 |
|
Less than 80 |
100 |
8 |
The class (40-50) has maximum frequency i.e. 20 therefore, modal class is 40-50.
f = 20
Now, l = 40, h = 10m, f1 = 20 and f2 = 11
f0 = 12 and modal class = 40 - 50 
Calculate the median of the following distribution of incomes of employees of a company.
|
Income |
No. of Persons |
|
400-500 |
25 |
|
500-600 |
69 |
|
600-700 |
107 |
|
700-800 |
170 |
|
800-900 |
201 |
|
900-1000 |
142 |
|
1000-1100 |
64 |
 Long Answer Type
Find the mean, mode and median for the following data :
|
Class |
0-10 |
10-20 |
20-30 |
30-40 |
40-50 |
Total |
|
Frequency |
8 |
16 |
36 |
34 |
6 |
100 |
 Short Answer Type
The median of the following data is 52.5. Find the values of x and y if the total frequency is 100.
|
Class Interval |
Frequency |
|
0-10 |
2 |
|
10-20 |
5 |
|
20-30 |
x |
|
30-40 |
12 |
|
40-50 |
17 |
|
50-60 |
20 |
|
60-70 |
y |
|
70-80 |
9 |
|
80-90 |
7 |
|
90-100 |
4 |
|
Total 100 |
Calculate the median from the following data:
|
Value |
Frequency |
|
Less than 10 |
4 |
|
Less than 20 |
16 |
|
Less than 30 |
40 |
|
Less than 40 |
76 |
|
Less than 50 |
96 |
|
Lc9s than 60 |
112 |
|
Less than 70 |
120 |
|
Less than 80 |
125 |
Calculate the median from the following data:
|
Size |
Frequency |
|
More than 50 |
0 |
|
More than 40 |
40 |
|
More than 30 |
98 |
|
More than 20 |
123 |
|
More than 10 |
165 |
 Long Answer Type
The median of the following data is 20.75. Find the missing frequencies x and y, if the total frequency is 100.
|
Class Interval |
0 - 5 |
5 - 10 |
10 - 15 |
15 - 20 |
20 - 25 |
25 - 30 |
30 - 35 |
35 - 40 |
|
Frequency |
7 |
10 |
x |
13 |
y |
10 |
14 |
9 |
