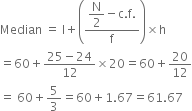
 Long Answer Type
A survey regarding the heights (in cm) of 50 girls of class X of a school was conducted and the following data was obtained:
|
Height in cm |
120 - 130 |
130 - 140 |
140 - 150 |
150 - 160 |
160 - 170 |
Total |
|
Number of girls |
2 |
8 |
12 |
20 |
8 |
50 |
Find mean, median and mode of the following data:
|
Classes |
Frequency |
|
0-20 |
6 |
|
20-40 |
8 |
|
40-60 |
10 |
|
60-80 |
12 |
|
80-100 |
6 |
|
100-120 |
5 |
|
120-140 |
3 |

Find mean, median and mode of the following data:
|
Classes |
Frequency |
|
0 - 50 |
2 |
|
50 - 100 |
3 |
|
100 - 150 |
5 |
|
150 - 200 |
6 |
|
200 - 250 |
5 |
|
250 - 300 |
3 |
|
300 - 350 |
1 |
The following table gives the daily income of 50 workers of a factory :
|
Daily income (in Rs.) |
No. of Workers |
|
100-120 |
12 |
|
120-140 |
14 |
|
140-160 |
8 |
|
160-180 |
6 |
|
180-200 |
10 |
Find the Mean, Mode and Median of the above data.
 Short Answer Type
Find the mode, median and mean for the following data :
|
Marks Obtained |
Number of Students |
|
25-35 |
7 |
|
35-45 |
31 |
|
45-55 |
33 |
|
55-65 |
17 |
|
65-75 |
11 |
|
75-85 |
1 |
 Long Answer Type
The table given below shows the frequency distribution of the scores obtained by 200 candidates in a BCA examination.
|
Score |
No. of candidates |
|
200-250 |
30 |
|
250-300 |
15 |
|
300-350 |
45 |
|
350-400 |
20 |
|
400-450 |
25 |
|
450-500 |
40 |
|
500-550 |
10 |
|
550-600 |
15 |
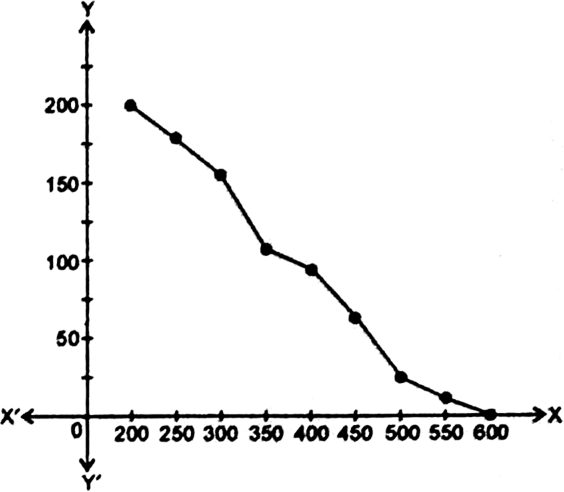
Draw cumulative frequency curves by using (i) 'less than series', (ii) 'more than series'.
e assume a class interval 150-200 prior to the first class interval 200-250 wtih zero frequency.
Cumulative frequency distribution [Less than Series]
|
Scroe |
c.f. |
|
Less than 200 |
0 |
|
Less than 250 |
30 |
|
Less than 300 |
45 |
|
Less than 350 |
90 |
|
Less than 400 |
110 |
|
Less than 450 |
135 |
|
Less than 500 |
175 |
|
Less than 550 |
185 |
|
Less than 600 |
200 |

More than Series
|
Scroe |
c.f. |
|
More than 200 |
200 |
|
More than 250 |
170 |
|
More than 300 |
155 |
|
More than 350 |
110 |
|
More than 400 |
90 |
|
More than 450 |
65 |
|
More than 500 |
25 |
|
More than 550 |
15 |
|
More than 600 |
0 |
Now, we plot the pts.: (200, 200), (250,170), (300,155), (350,110), (400, 90), (450, 65), (500, 25), (550, 15) and (600, 0).
Draw both types of cumulative freqneucy curve on the same graph paper and then determine the median.
|
Marks obtained |
No. of students |
|
50-60 |
4 |
|
60-70 |
8 |
|
70-80 |
12 |
|
80-90 |
6 |
|
90-100 |
6 |
Draw 'less than' and 'more than' ogive curve from the following and indicate the value of median.
|
Marks |
No. of students (f) |
|
0-5 |
7 |
|
5-10 |
10 |
|
10-15 |
20 |
|
15-20 |
13 |
|
20-25 |
12 |
|
25-30 |
10 |
|
30-35 |
14 |
|
35-40 |
9 |
|
Daily Income (in Rs.) |
Number of Workers |
|
100-120 |
12 |
|
120-140 |
14 |
|
140-160 |
8 |
|
160-180 |
6 |
|
180-200 |
10 |
During the medical check-up of 35 students of a class their weights were recorded as follows:
|
Weight (in kg.) |
No. of Students |
|
38—40 |
3 |
|
40—42 |
2 |
|
42—44 |
4 |
|
44—46 |
5 |
|
46—48 |
14 |
|
48—50 |
4 |
|
50—52 |
3 |
Draw a less than type and a more than type ogive from the given data. Hence obtain the median weight from the graph.
