 Multiple Choice Questions
Environmental conditions can influence the accumulation of species in successional communities. Curved representing changes in forest species over time are given in the figure below. Which of the following keys is correct for the curves?
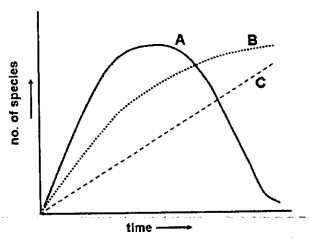
A = xeric; B = mesic; C = intermediate
A= intermediate; B = xeric; C = mesic
A = intermediate; B = mesic; C = xeric
A = mesic; B = intermediate; C = xeric
Three islands have identical habitat characteristics. On first island rodent species A is present at a density 325/ km2. Second island has only species B at a density of 179/km2. On the third island, both A and B co-exist with densities 297/km2 and 150/km2, respectively. Which of the following can be inferred from this?
The two species do not compete with each other.
The intra-species competition is more intense than inter-species competition.
The inter-species competition is more intense than intra-species competition.
The inter and intra species competition are of the same intensity.
A few males and females of a species were introduced to a new island. Their population was monitored over several generations and followed a pattern shown in the figure:
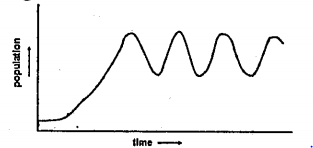
Which of the characteristics of the species does NOT explain the pattern?
Skewed sex ratio (more females than males)
Large litter size
Delayed sexual maturity
Effects of intra-uterine development on fecundity
The following graph is for a logistically growing population, with Nt plotted on the X-axis. What is the parameter plotted on the Y-axis?
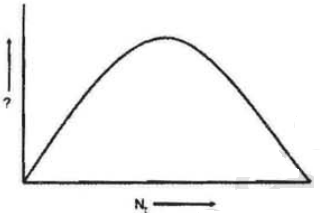
dN/dt
Nt + 1
dN/ dt .
K
In the following diagram, two models of succession are represented. In this diagram A, B, C, and D are species and arrows indicate is replaced by
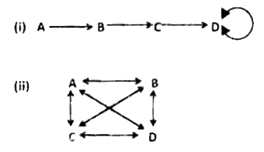
Based on the above, which statement is correct?
Fig. (i) represents the facilitation model and Fig. (ii) represents the tolerance model.
Fig. (i) represents the tolerance model and Fig. (ii) represents the facilitation model.
Fig. (i) represents the facilitation model and Fig. (ii) represents the inhibition model.
Fig. (i) represents the tolerance model and Fig. (ii) represents the inhibition model.
Lindeman's efficiency between trophic levels is depicted by the formula:
Efficiency -
where, A and B respectively are:
'assimilation at trophic level n' and 'assimilation at trophic level n - 1'
'intake at trophic level n' and 'assimilation at trophic level n - 1'
'assimilation at trophic level n' and 'net productivity at trophic level n - 1'
'intake at trophic level n' and 'net productivity at trophic level n - 1'
The following matrix shows the relationship between the probability of death and duration of species association.
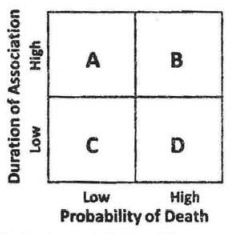
In the above, A, B, C, and D are:
A - Parasites; B - Parasitoids; C - Grazers ; D - Predators
A - Carnivores; B - Herbivores; C - Parasites; D - Parasitoids
A - Grazers; B - Parasites; C - Herbivores; D - Parasitoids
A - Predators; B = Parasitoids; C - Parasites; D - Carnivores
A.
A - Parasites; B - Parasitoids; C - Grazers ; D - Predators
In the above-given diagram, A, B, C, and D are Parasites, Parasitoids, Grazers, and Predators respectively.
An observation was made on a species experiencing three factors A, B, and C in order to infer a density-dependent population regulation by a factor. The following graph shows the relationship between the adverse effect of the factors in terms of number and population density.
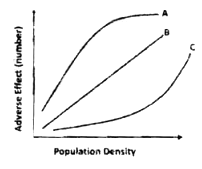
Based on the above observation, which of the following is correct?
A - Density independent; B - Density-dependent; C - Inversely density dependent
A - Inversely density dependent; B - Density-independent; C - Density dependent.
A - Density dependent; B - Inversely density independent; C - Density independent
A - Density dependent; B - Density independent; C - Inversely density dependent
The following genotypes were observed in a population
| Genotype | Number |
| HH | 90 |
| Hh | 60 |
| hh | 50 |
Which of the following is the correct frequency of H allele and what will be the expected number of HH in the given population?
0.60 and 72
0.80 and 96
0.50 and 32
0.30 and 90
0.30 and 90
0.50 and 32
0.30 and 90
