 Multiple Choice Questions
Which one of the following statements is true for the trends of Dissolved Oxygen (DO) and Biological Oxygen Demand (BOD) in a water stream receiving pollutants from a point source?
In septic zone, both DO and BOD levels remain stationary.
In recovery zone, both DO and BOD levels increase rapidly.
In decomposition zone, DO level drops rapidly, whereas BOD level remains more or less stable.
In septic zone, DO level decreases and BOD level increases whereas in recovery zone DO increases and BOD decreases.
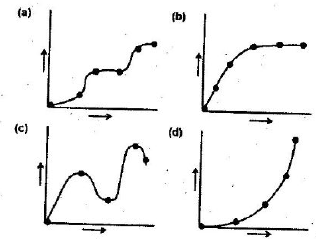
Following are the graphical representations of various hypotheses proposed for explaining the possible relationships between species richness (X-axis) and community services (Y-axis).

Which of the following options is the correct match between the graphical representations and the hypotheses?
(a) Redundancy; (b) Keystone; (c) River; (d) Idiosyncratic
(a) Idiosncratic; (b) River; (c) Keystone; (d) Redundancy
(a) Rivet; (b) Redundancy; (c) Idiosyncratic; (d) Keystone
(a) Rivet; (b) Keystone; (c) Redundancy; (d) Idiosyncratic
C.
(a) Rivet; (b) Redundancy; (c) Idiosyncratic; (d) Keystone
The correct match is-
(a) Rivet; (b) Redundancy; (c) Idiosyncratic; (d) Keystone
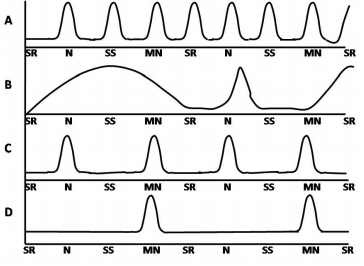
Following are the plots representing biological rhythms at different time points depicted as: SR - Sunrise; N = North; SS - Sunset; MN - Midnight

Which of the plot(s) represent the ultradian biological rhythm(s)?
Plot B
Plots A and C
Plots C and D
Plot D
The frequency of M-N blood types in a population of 6129 individuals is as follows:
| Blood type | Genotype | Number of individuals |
| M | LMLM | 1787 |
| MN | LMLN | 3039 |
| N | LNLN | 1303 |
The frequency of LN allele in this population is
0.4605
0.2121
0.5395
0.2911
To understand the prey-predator relationship, Didinium (predator) and the Paramecium population were grown with sand sediment as a hiding place or refuge. To this population, Didinium was introduced only once. What would happen to the prey population in the course of time?
The population will steadily decrease and vanish.
The population will initially increase and then sabilize.
The population will initially decrease, then increase and stabilize.
The population will steadily increase.
Which one of the following is NOT correct?
Island ecosystems are less prone to biological invasion because of their distance from the mainland.
Invasive species have greater phenotypic plasticity compared to native species.
Invasive species have high dispersal ability.
At a large scale, diversity rich ecosystems are generally more prone to invasion.
Which one of the following is in the correct decreasing order for the major reservoirs of carbon on Earth?
Terrestrial soils > Terrestrial vegetation > Atmospheric CO2 > Large lake sediments
Terrestrial soil > Large lake sediments > Terrestrial vegetation > Atmospheric CO2
Atmospheric CO2 > Large lake sediments > Terrestrial soils > Terrestrial vegetation
Large lake sediments > Terrestrial soils > Atmospheric CO2 > Terrestrial vegetation
As per national air quality standard for India, which one of the following options gives correct concentration limits (μg m-3, annual) of various gaseous air pollutants for a residential area?
SO2- 100; NO2 - 40; O3 - 40; CO - 50
SO2 - 50; NO2 - 40; O3 - 100; CO - 02
SO2 - 40; NO2 - 50; O3 - 50; CO - 10
SO2 - 50; NO2 - 100; O3 - 40; CO - 02
Following are the descriptions used by conservation biologists for characterizing species/ groups in a community:
A. Species with a disproportionally large effect on its environment relative to its abundance.
B. Species defining a trait or characteristics of the environment.
C. Species whose conservation leads to direct protection of other species.
D. Species which is instantly recognizable and used as the focus of a broader conservation effort.
Which of the following combination correctly identifies these species or groups?
A - Keystone species; B - Indicator species; C - Flagship species; D - Umbrella species
A - Keystone species; B - Indicator species; C - Umbrella species; D - Flagship species.
A - Indicator species; B - Flagship species; C - Umbrella species; D - Keystone species
A - Umbrella species; B - Indicator species; C - Keystone species; D - Flagship species
Which one of the following statements is NOT correct?
Herbivores enhance the productivity of a productive ecosystem and reduce the productivity of an unproductive ecosystem.
Detritus based food chains are longer in more productive ecosystems.
Consumption efficiency of herbivores is higher in grasslands than in the ocean.
Production efficiency of carnivores is higher than herbivores.
