 Multiple Choice Questions
The colour of the +ve column in a gas discharge tube depends on
the type of glass used to construct the tube
the gas in the tube
the applied voltage
the material of the cathode
The rms speed of the molecules of a gas in a vessel is 400 ms. If half of the gas leaks out, at constant temperature, the rms speed of the remaining molecules will be
800 ms-1
400 ms-1
200 ms-1
An electron tube was sealed off during manufacture at a pressure of 1.2 x 10⁻⁷ mm of mercury at 27°C. Its volume is 100 cm3. The number of molecules that remain in the tube is
2 × 10¹⁶
3 × 10¹⁵
3.86 × 10¹¹
5 × 10¹¹
A constant volume gas thermometer works on
Archimede's principle
Pascal's law
Boyle's law
Charle's law
A sample of ideal monoatomic gas is taken round the cycle ABCA as shown in the figure. The work done during the cycle is

3 pV
zero
9 pV
6 pV
Heavy water is
compound of deuterium and oxygen
water at 4°C
water, in which soap does not lather
compound of heavy oxygen and heavy hydrogen
Oxygen is 16 times heavier than hydrogen. Equal volumes of hydrogen and oxygen are mixed. The ratio of speed of sound in the mixture to that in hydrogen is
Specific rotation of sugar solution is 0.01 SI units. 200 kgm-3 of impure sugar solution is taken in a polarimeter tube of length 0.25 m and an optical rotation of 0.4 rad is observed. The percentage of purity of sugar in the sample is
11 %
20 %
80 %
89 %
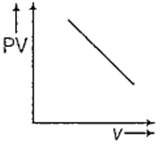
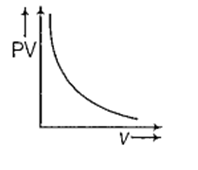
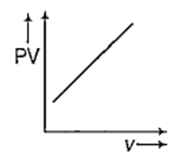
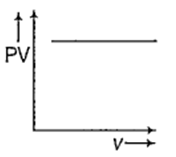
Which one of the following graphs represents the behaviour of an ideal gas ?


D.

For an ideal gas keeping the temperature same throughout,
PV = constant
Hence, for a given mass, the graph between PV and V will be a straight line parallel to V-axis whatever may be the volume.
