 Multiple Choice Questions
Study the histogram of weight distribution of different men and answer question no. 100.
Average number of men per interval who participated in this survey is
200
180
214
214
The bar graph provided below represents the production of rice and wheat in different states of a country in a certain year. Answer questions 96 to 100 based on the bar graph.
The total production of rice and wheat in all the mentioned states is minimum in the state
B
C
D
D
C.
D
It is concluded from the figure that total production of rice and wheat is minimum in state D.
The bar graph provided below represents the production of rice and wheat in different states of a country in a certain year. Answer questions 96 to 100 based on the bar graph.
The ratio of total production of rice in the mentioned states to that of wheat in those states, is
15 : 16
12 : 13
13 : 14
13 : 14
The bar graph provided below represents the production of rice and wheat in different states of a country in a certain year. Answer questions 96 to 100 based on the bar graph.
The difference between the production in rice and wheat is maximum in
A only
All of A, B and E
B and E both
B and E both
The bar graph provided below represents the production of rice and wheat in different states of a country in a certain year. Answer questions 96 to 100 based on the bar graph.
The state which is the largest producer of rice is
A
B
C
C
The bar graph provided below represents the production of rice and wheat in different states of a country in a certain year. Answer questions 96 to 100 based on the bar graph.
The average of production of rice in the mentioned states (in lakh tonnes) is
5.5
5.6
5.7
5.7
The bar chart given below shows the percentage distribution of the production of various models of a mobile manufacturing company in 2007 and 2008. The total production in 2007 was 35 lakh mobile phones and in 2008 the production was 44 lakh. Study the chart and answer the following questions.
Percentage of six different types of mobiles manufactured by a company over two years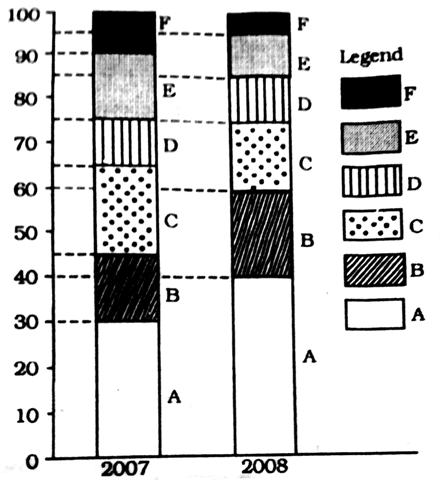
Total number of mobiles of models A, B and E manufactured in 2007 was
24,50,000
22,75,000
21,00,000
21,00,000
The bar chart given below shows the percentage distribution of the production of various models of a mobile manufacturing company in 2007 and 2008. The total production in 2007 was 35 lakh mobile phones and in 2008 the production was 44 lakh. Study the chart and answer the following questions.
Percentage of six different types of mobiles manufactured by a company over two years
For which models was the percentage variation in production from 2007 to 2008 the maximum?
B and C
C and D
D and E
D and E
The bar chart given below shows the percentage distribution of the production of various models of a mobile manufacturing company in 2007 and 2008. The total production in 2007 was 35 lakh mobile phones and in 2008 the production was 44 lakh. Study the chart and answer the following questions.
Percentage of six different types of mobiles manufactured by a company over two years
What was the difference in the number of B type mobiles produced in 2007 and 2008?
3,55,000
2,70,000
2,25,000
2,25,000
The bar chart given below shows the percentage distribution of the production of various models of a mobile manufacturing company in 2007 and 2008. The total production in 2007 was 35 lakh mobile phones and in 2008 the production was 44 lakh. Study the chart and answer the following questions.
Percentage of six different types of mobiles manufactured by a company over two years
If the percentage production of A-type mobiles in 2008 was same as that in 2007, then the number of A-type mobiles produced in 2008 would have been
14,00,000
13,20,000
11,70,000
11,70,000


 Switch


