 Multiple Choice Questions
The bar chart given below shows the percentage distribution of the production of various models of a mobile manufacturing company in 2007 and 2008. The total production in 2007 was 35 lakh mobile phones and in 2008 the production was 44 lakh. Study the chart and answer the following questions.
Percentage of six different types of mobiles manufactured by a company over two years.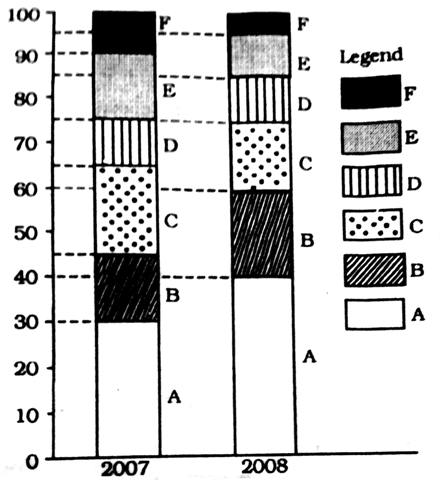
If 85% of the D type mobiles produced in each year were sold by the company, how many D type mobiles remained unsold?
76,500
93,500
1,18,500
1,18,500
Study the bar diagram and answer these questions.
The number of persons killed in coal mines in 2006 was what per cent of those killed in industrial accidents in that year?
4
25
36
36
Study the bar diagram and answer these questions.
In which year, minimum number of persons were killed in industrial accidents and coal mines together?
2006
2007
2008
2008
Study the bar diagram and answer these questions.
In which year, maximum number of persons were killed in industrial accidents other than those killed in coal mines?
2006
2007
2008
2008
Study the bar diagram and answer these questions.
In which year, minimum number of persons were killed in coal mines other than those killed in industrial accidents?
2006
2007
2008
2008
A bar graph showing the heights of six mountain peaks. Study the bar graph and answer the questions.
The average height of all the peaks (in m) is
7601.5
7600
7599.5
7599.5
A bar graph showing the heights of six mountain peaks. Study the bar graph and answer the questions.
Which peak is the second highest?
B
C
A
A
A bar graph showing the heights of six mountain peaks. Study the bar graph and answer the questions.
Write the ratio of the heights of the highest peak and the lowest peak.
22 : 15
15 : 22
20 : 13
20 : 13
A bar graph showing the heights of six mountain peaks. Study the bar graph and answer the questions.
When the heights of the given peaks are written in ascending order, what is the average of the middle two peaks?
7950 m
7560 m
7650 m
7650 m


 Switch


