 Multiple Choice Questions
The following graph shows the production of wheat flour (in 1000 tonnes) by three companies X, Y and Z over the year. Study the graph and answer questions given below.
What is the difference between the production of company Z in 2004 and company Y in 2000 (in thousand tonnes)?
2000
100
20
2
B.
100
Production of company Z in the year 2004 = 350 tonnes
Production of company Y in the year 2000 = 250 tonnes
∴ Required difference = (350 - 250) tonnes
= 100 thousand tonnes
The following graph shows the production of wheat flour (in 1000 tonnes) by three companies X, Y and Z over the year. Study the graph and answer questions given below.
What is the ratio of the average production of company X in the period 2002-2004 to the average production of company Y in the same period?
1 : 1
15 : 17
23 : 25
27 : 29
The following graph shows the production of wheat flour (in 1000 tonnes) by three companies X, Y and Z over the year. Study the graph and answer questions given below.
What is the percentage increase in the production of company Y from 2002 to 2003?


25
40
The following graph shows the production of wheat flour (in 1000 tonnes) by three companies X, Y and Z over the year. Study the graph and answer questions given below.
The average production for five year was maximum for which company?
Both X and Z
Y
Z
Both X and Y
The following Bar Diagram shows the percentage of 7 coloured balls sold in 5 shops A, B, C, D and E. Study the graph and answer all the questions.
In shop A, the ratio of percentage of violet balls and yellow balls is
7: 4
6 : 1
2 : 4
2 : 7
The following Bar Diagram shows the percentage of 7 coloured balls sold in 5 shops A, B, C, D and E. Study the graph and answer all the questions.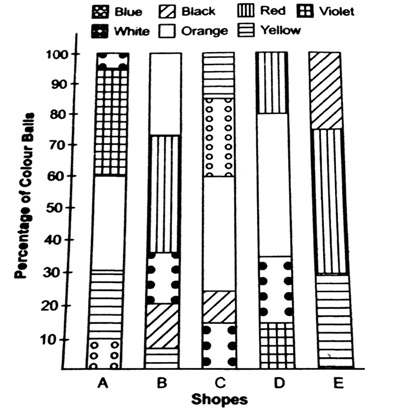
The difference between total number of per cent of violet balls and total number of per cent of blue balls is
15
25
40
10
The following Bar Diagram shows the percentage of 7 coloured balls sold in 5 shops A, B, C, D and E. Study the graph and answer all the questions.
The shops having equal percentage of white balls are
C and E
B and C
A and B
A and C
The following Bar Diagram shows the percentage of 7 coloured balls sold in 5 shops A, B, C, D and E. Study the graph and answer all the questions.
The ratio of total percentage of red balls and total percentage of orange balls is
4 : 5
9 : 11
7 : 9
1 : 1
Study the graph and answer the questions.
Production of 3 Different Flavours of Health Drinks of a company 6 Years in (lakh bottles)
What was the approximate decline in the production of flavour R in 2010 as compared to the production of 2008 in percentage?
30.33%
53.33%
43.33%
33.33%
Study the graph and answer the questions.
Production of 3 Different Flavours of Health Drinks of a company 6 Years in (lakh bottles)
The average annual production of which flavour was maximum in the given period?
Both P and R
Only P
Both P and Q
Only Q


 Switch


