 Multiple Choice Questions
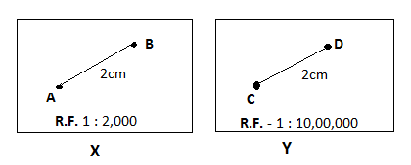
Consider the following figures X and Y :

Figure X is small-scale map and distance between A and B is 40 metres.
Figure Y is large-scale map and distance between C and D is km.
Figure X is large scale map and figure Y is small-scale and distance between A and B and C and D are 40 metres and 20 km respectively.
Figure X is large scale and Figure Y is small-scale . The ground distance between A and B and C and D.
C.
Figure X is large scale map and figure Y is small-scale and distance between A and B and C and D are 40 metres and 20 km respectively.
ASSERTION (A) : Dot map is especially useful when the values are disturbed unevenly and sporadically.
REASON (R) : Smaller the statistical unit , more accurate is the Dot Map.
Both (A) and (R) are true and (R) is the correct explanation of (A).
Both (A) and (R) are true but (R) is not the correct explanation of (A).
(A) is true , but (R) is false.
(A) is false , but (R) is true.
In linear regression equation , Y= a+bX , if mean of X and Y series are 23 and 94.5 respectively and slope gradient is 1.5 , then what is the value of intercept , a , in the distribution of X,Y series ?
50
55
60
65
ASSERTION (A) : Maps that are usually referring various attributes information are called Complex Thematic Maps.
REASON (R) : Complex Thematic Maps are used to show locations of Earth's different features and activities.
(A) is false , but (R) is true.
(A) is true , but (R) is false.
Both (A) and (R) are true and (R) is the correct explanation of (A).
Both (A) and (R) are true but (R) is not the correct explanation of (A).
|
LIST I (Value of Rx Statistics) |
LIST II (Pattern of Distribution) |
| (a) <0.5 | (1) Perfect Uniform |
| (b) 0.75 - 1.25 | (2) Tending to uniform |
| (c) 1.75 - 2.00 | (3) Tendong to random |
| (d) 2.15 | (4) Tending to cluster |
a-2 , b-1 , c-4 , d-3
a-1 , b-2 , c-3 , d-4
a-4 , b-3 , c-2 , d-1
a-3 , b-4 , c-1 , d-2
ASSERTION (A) : Remote sensing is defined as the science and art of acquiring data about the earth's objects from a distance without physical contact.
REASON (R) : The collection of data is only conducted by means of remote sensors installed in aircraft and satellite.
Both (A) and (R) are true and (R) is the correct explanation of (A).
Both (A) and (R) are true but (R) is not the correct explanation of (A).
(A) is true , but (R) is false.
(A) is false , but (R) is true.
|
LIST I (Land Use / Cover Types) |
LIST II (Conventional colour map symbols) |
| (a) Forests | (1) Yellow |
| (b) Cultivated areas | (2) Red |
| (c) Uncultivable Land | (3) Dark Green |
| (d) Built up area | (4) Brown |
a-3 , b-1 , c-4 , d-2
a-4 , b-3 , c-2 , d-1
a-1 , b-4 , c-2 , d-3
a-3 , b-1 , c-2 , d-4
Which one of the following systems uses the vector and raster data ?
Remote Sensing System
Geographical Information System
Global Positioning System
Both (A) and (B)
