 Multiple Choice Questions
|
LIST I (Aspect) |
LIST II (Diagram) |
| (a) Rural and Urban Population | (i) Comparative Bars |
| (b) Population density | (ii) Isolines |
| (c) Relative relief | (iii) Dots and spheres |
| (d) Decadal population | (iv) Choropleth |
a-iv , b-iii , c-i , d-ii
a-i , b-ii , c-iii , d-iv
a-ii , b-i , c-iv , d-iii
a-iii , b-iv , c-ii , d-i
Consider the following road network diagram of an area :
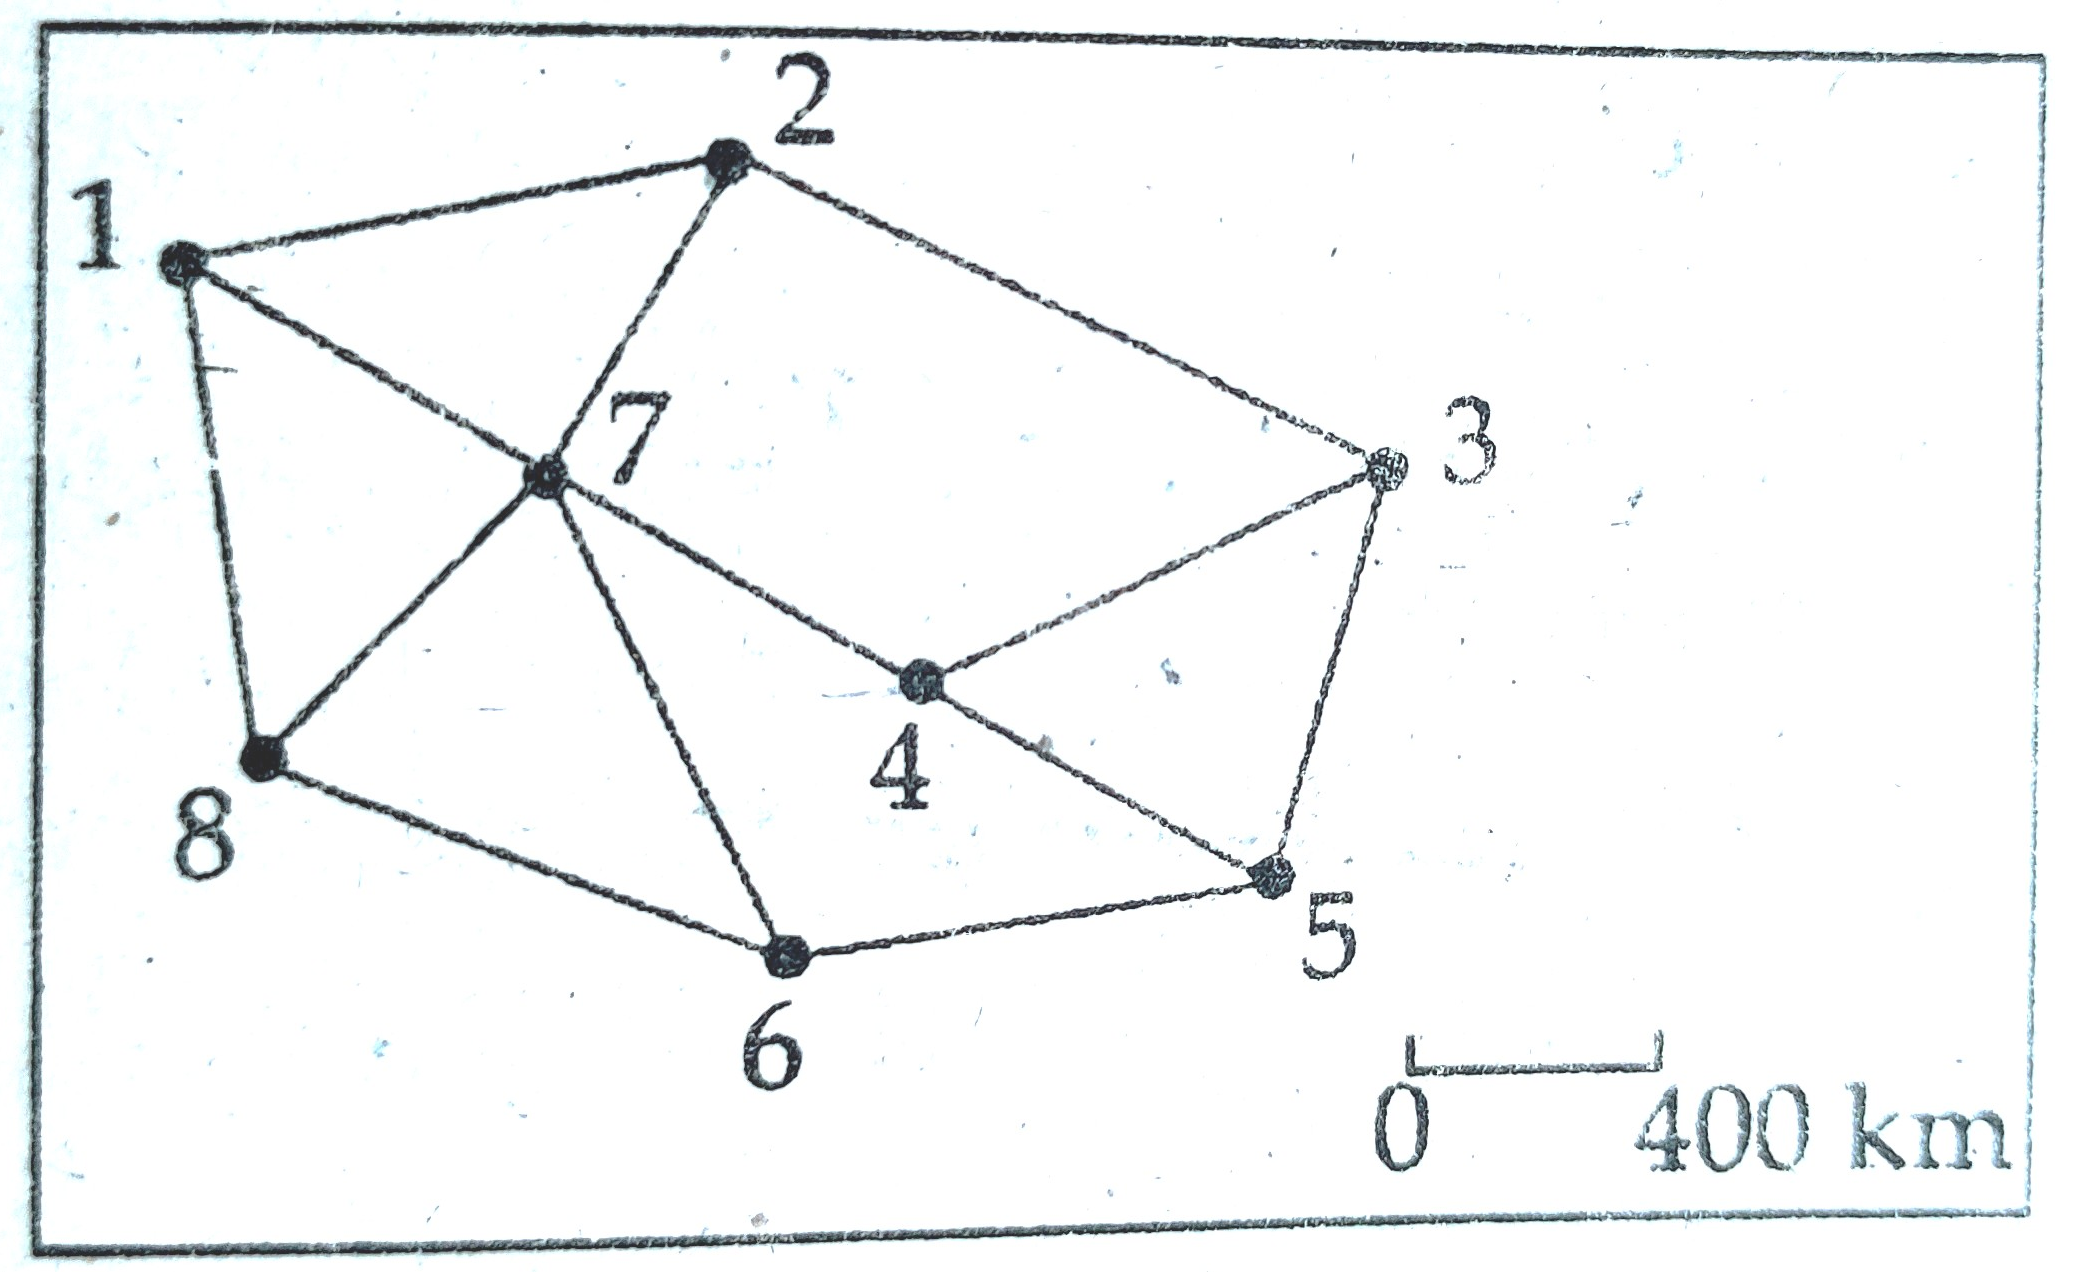
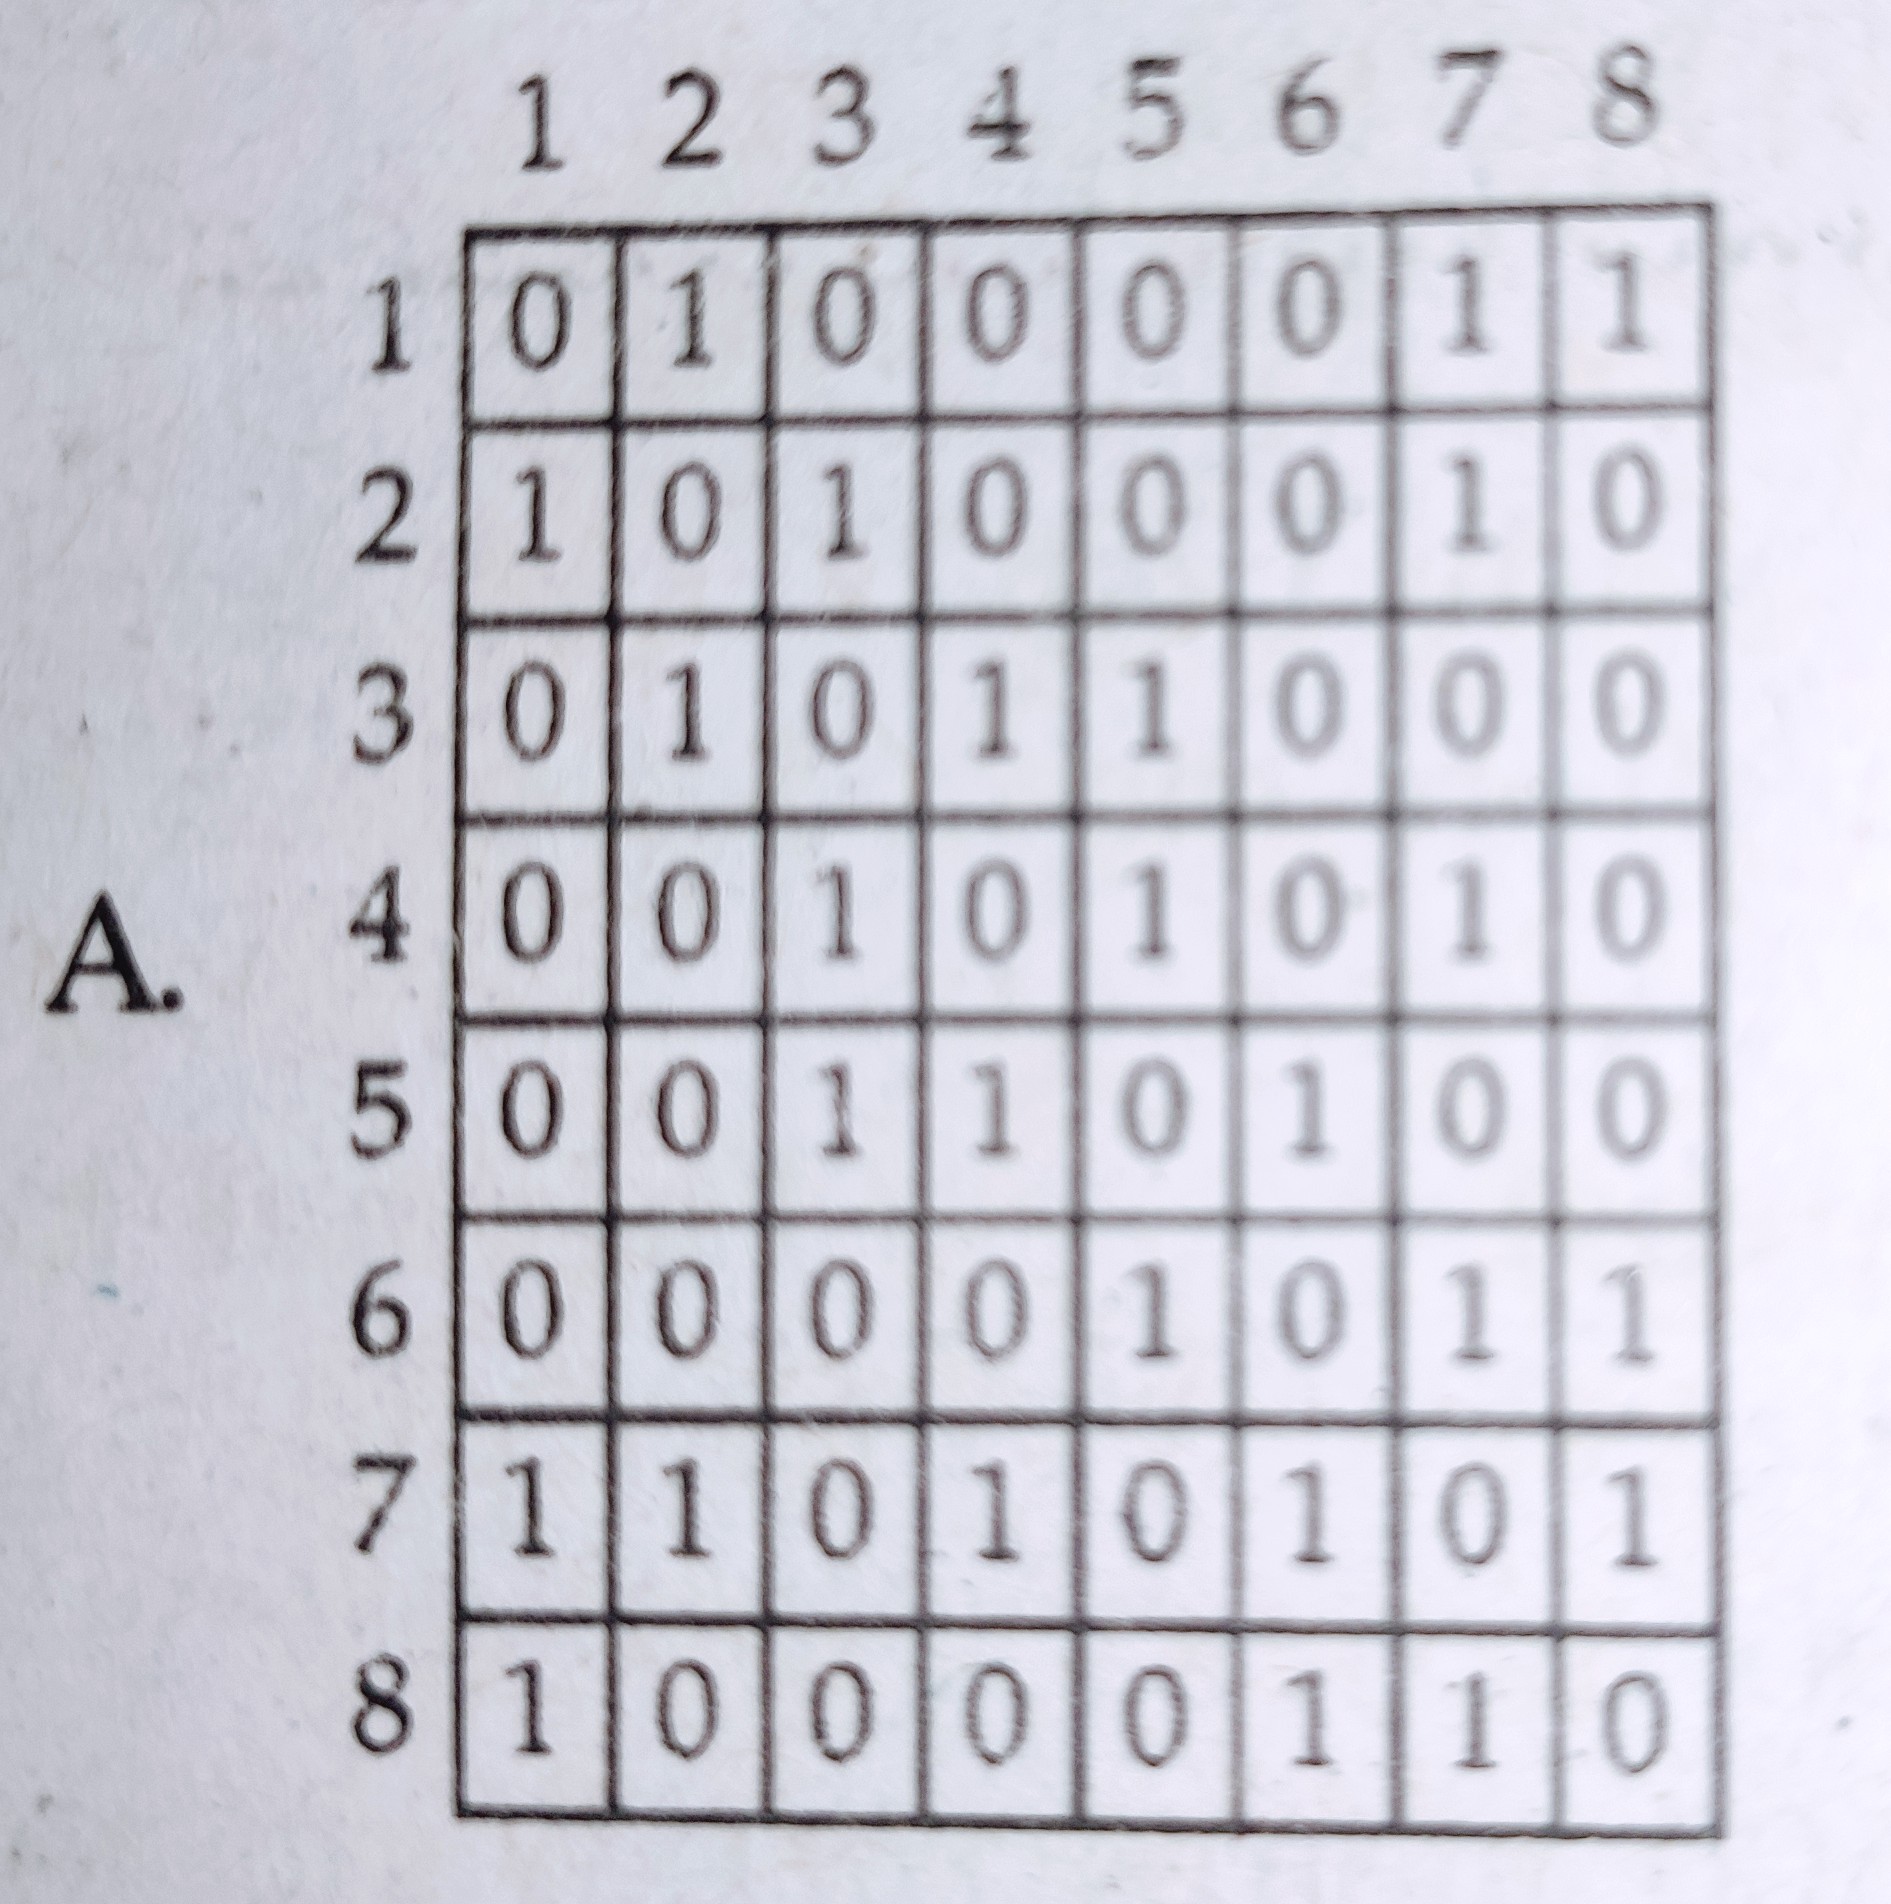
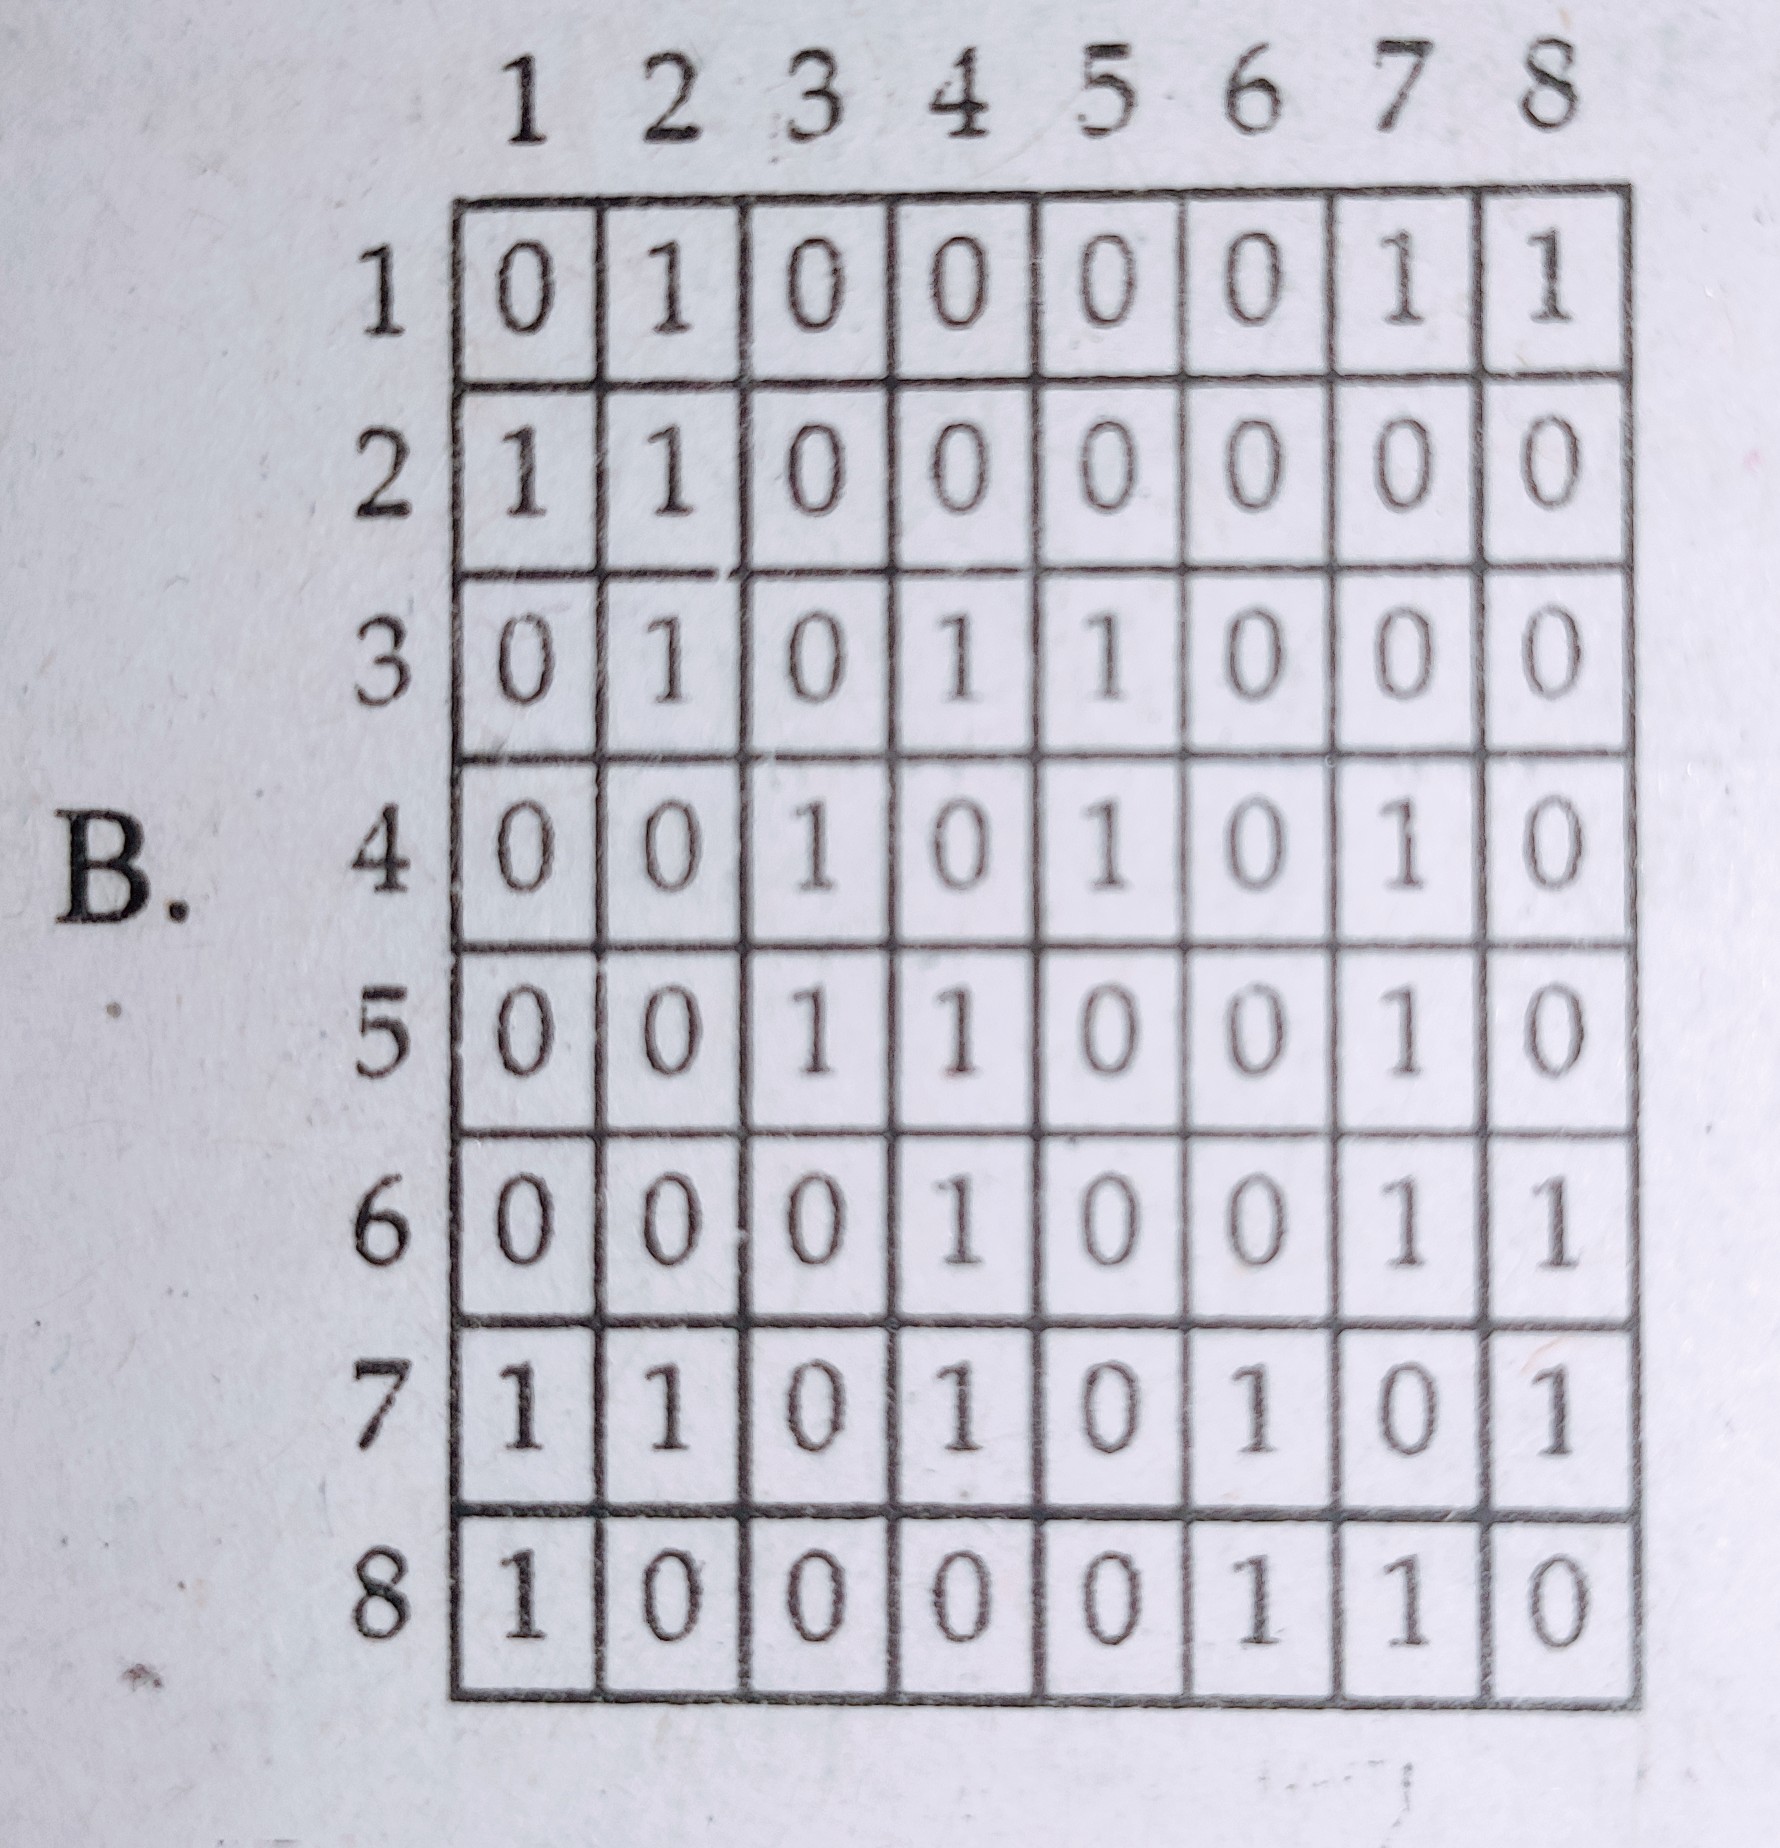
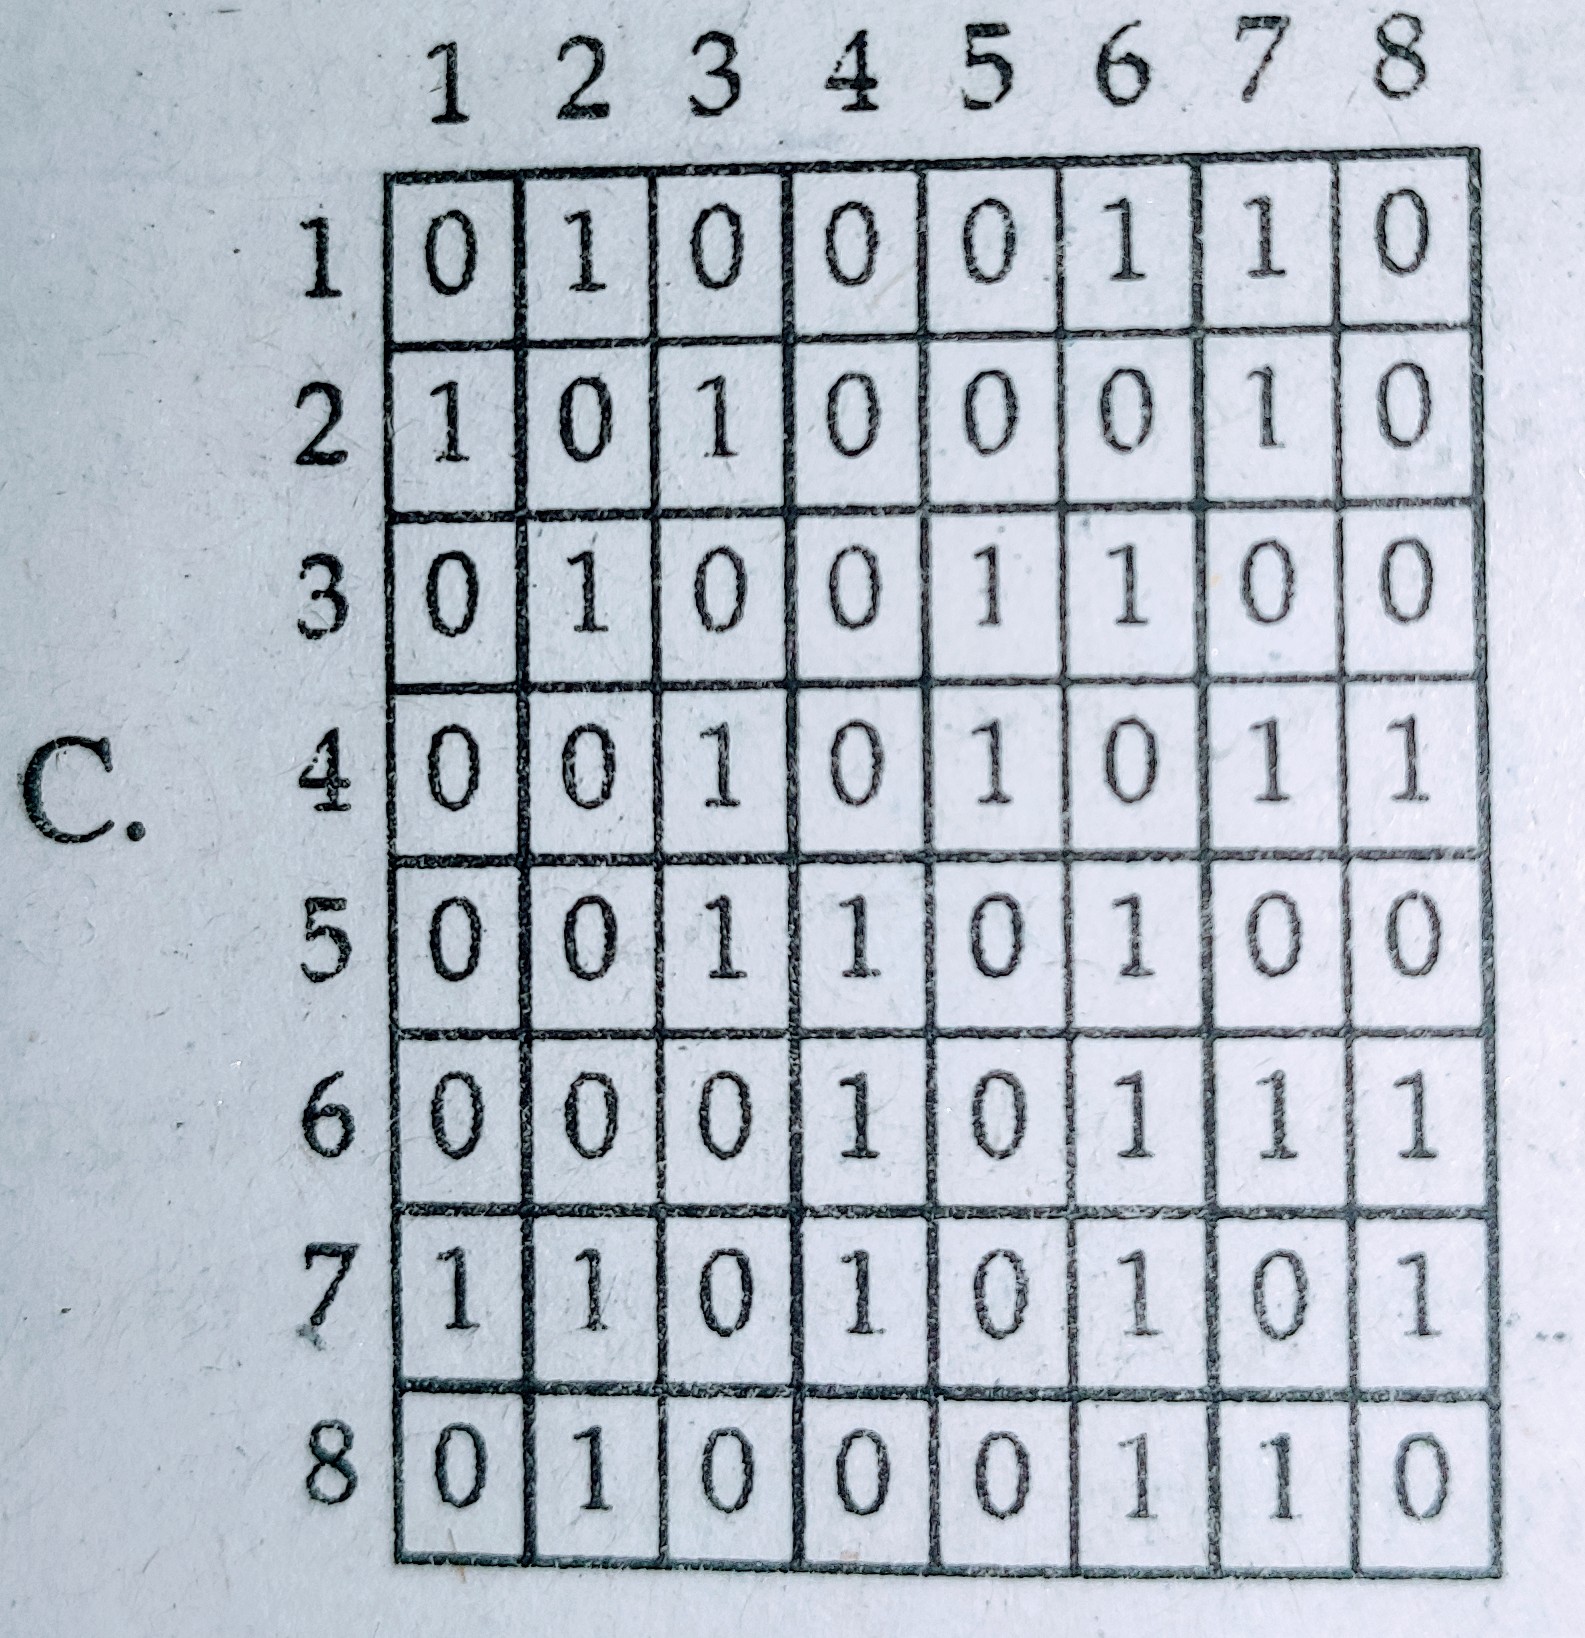
Select the correct connectivity matrix for the above network :
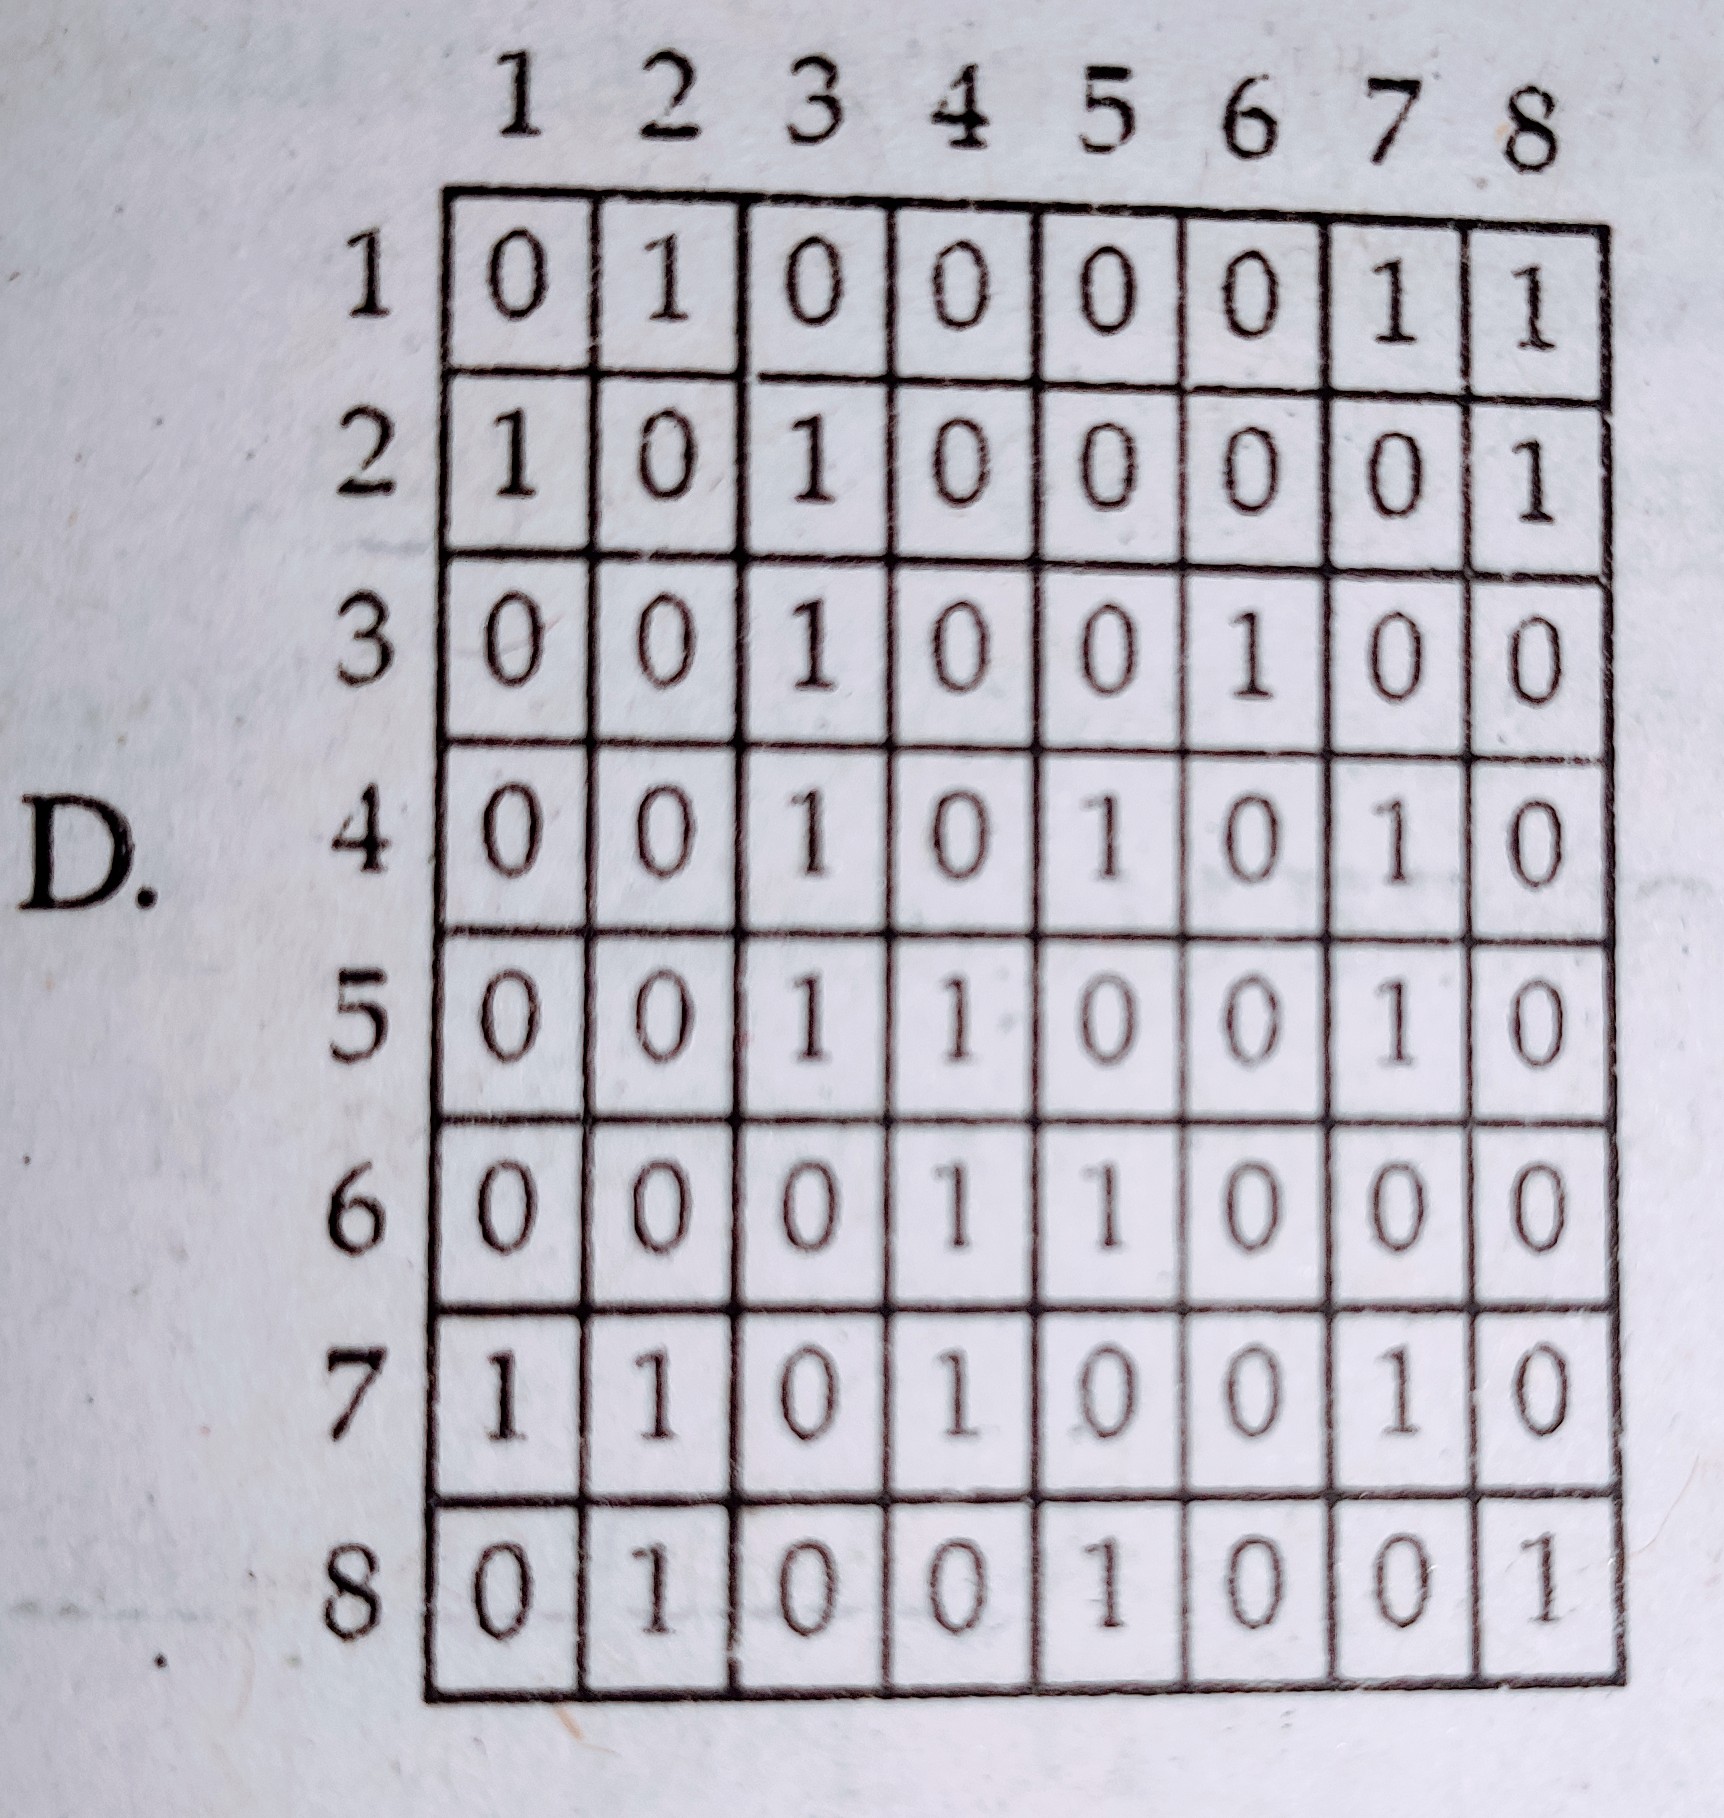
Which one of the following authors suggested a fivefold divisions of adopters on the basis of the time lag between receiving and acting upon new information as shown in diagram below ?
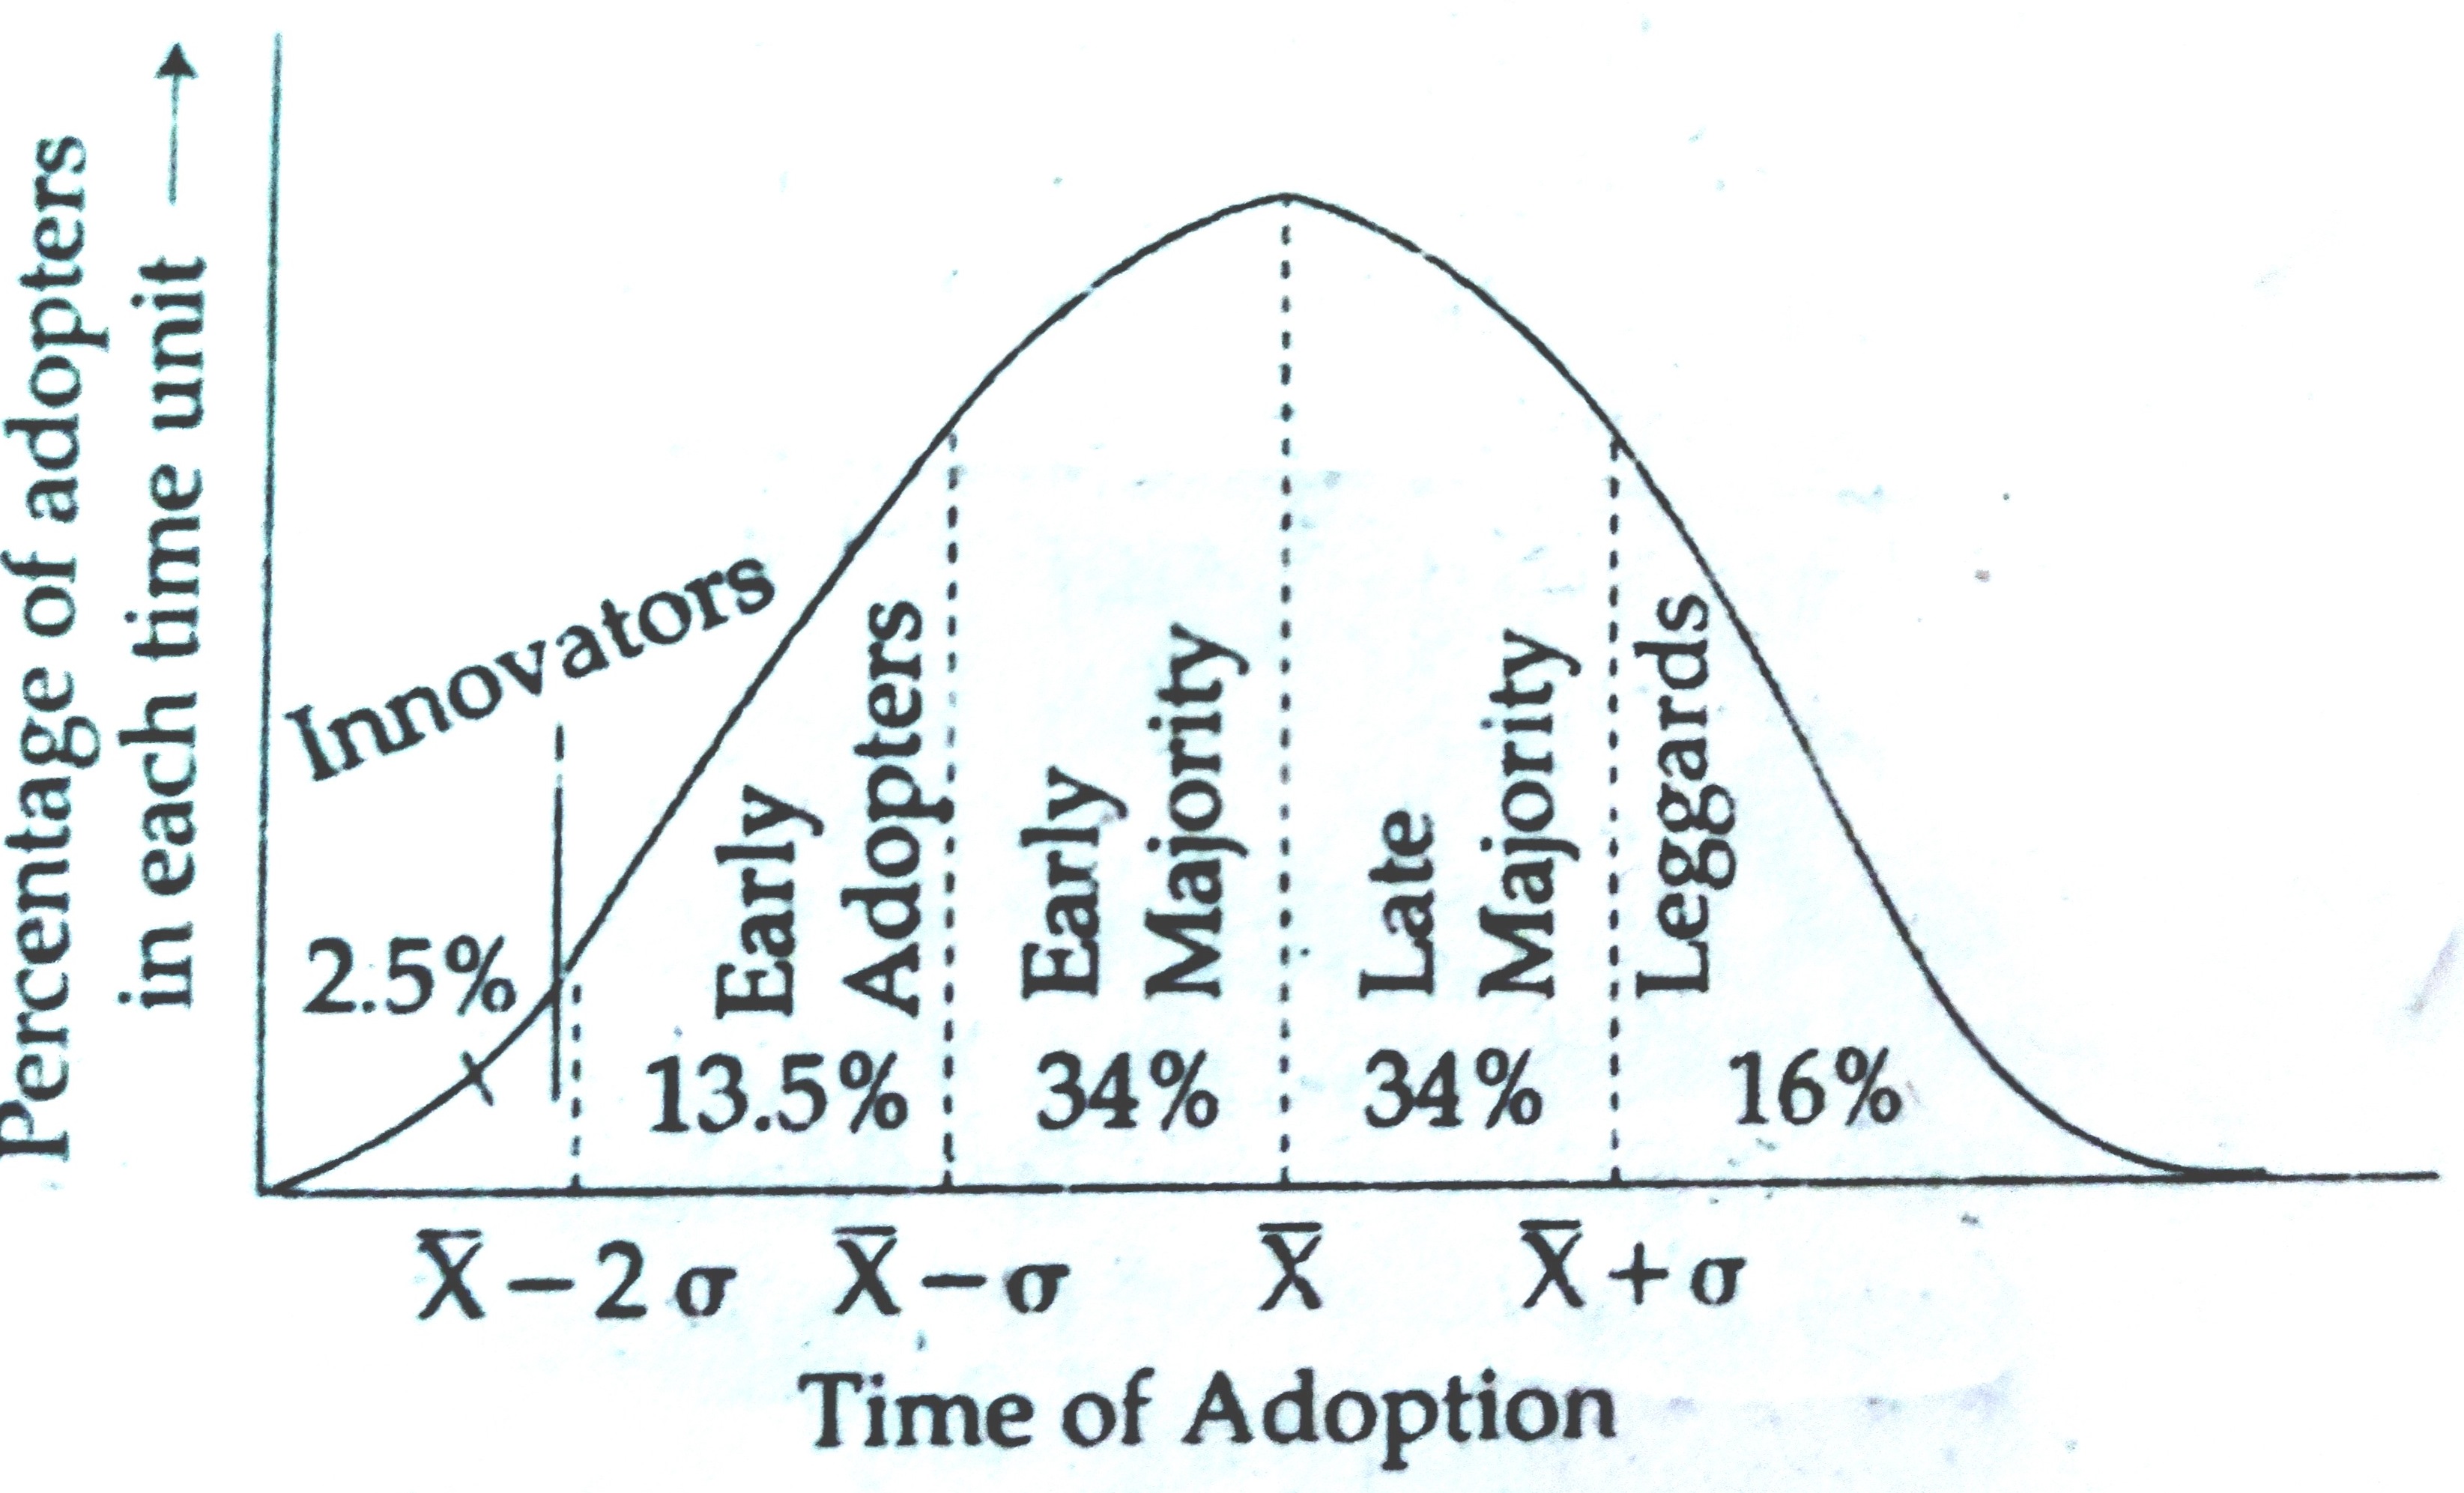
E.M . Rogers
L.W. Bowden
Z. Giriliches
T. Haggerstrand
Which one of the following is correct ?
Arithmetic mean is a numeric value
Arithmetic mean is not affected by the variability in the data sets
Arithmetic mean is always a positive number
Arithmetic mean is notn useful for any further statistical analysis of the the data
Which one of the following central tendencies is the appropriate method for the study of dispersion ?
Arithmetic Mean
Median
Mode
Geometric mean
Which one of the following cartographic techniques is suitable for measuring spatial association among different attributes of the regional economy ?
Bar diagram
Pie diagram
Choropleth
Isopleth
B.
Pie diagram
| LIST I | LIST II |
| (a) Isopleth | (i) Natural grouping |
| (b) Dot maps | (ii) Distribution of population |
| (c) Scatter diagrams | (iii) Wind direction |
| (d) Star diagrams | (iv) Changes which are relatively gradual |
a-iv , b-ii , c-iii , d-i
a-ii , b-iv , c-iii , d-i
a-iv , b-ii , c-i , d-iii
a-ii , b-iv , c-i , d-iii
Spatial data is tored in computer by using :
Plotter digitizer and keyboard
Keyboard and plotter
Scanner , digitizer and keyboard
Digitizer and scanner
LANDSAT , SPOT and IRS are examples of :
Sun-synchronous satellites
Geostationary satellites
Radars
Natural satellites
Which one of the following statistical method is best suited for groundwater exploration by using GIS tools ?
Stanadard deviation method
Principal component analysis method
Trial and error method
Index - overlay method
