 Short Answer Type
The Mean of the following distribution is 52 and the frequency of class interval 30-40 is ‘f’. Find ‘f’.
| Class Interval | 10 - 20 | 20 - 30 | 30 - 40 | 40 - 50 | 50 - 60 | 60 - 70 | 70 - 80 |
| Frequency | 5 | 3 | f | 7 | 2 | 6 | 13 |
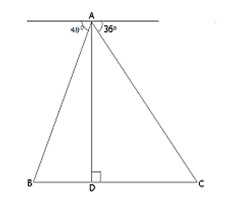
From the top of a light house 100 m high the angles of depression of two ships on opposite sides of it are 48 and 36 respectively. Find the distance between the two ships to the nearest metre.
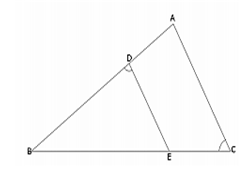
In the given figure ABC is a triangle withEDB =ACB.
Prove that ABC EBD. If BE = 6 cm, EC = 4 cm, BD = 5 cm. And area of
BED = 9
cm2. Calculate the
(i) length of AB
(ii) area of
Vivek invests Rs 4500 in 8%. Rs. 10 shares at Rs. 15. He sells the shares when the price rises to Rs. 30, and invests the proceeds in 12% Rs. 100 shares at Rs. 125. Calculate.
(i) the sale proceeds
(ii) the number of Rs. 125 shares he buys.
(iii) the change in his annual income from dividend.
A positive number is divided into two parts such that the sum of the squares of the two parts is 20. The square of the larger part is 8 times the smaller part. Taking x as the smaller part of the two parts, find the number.
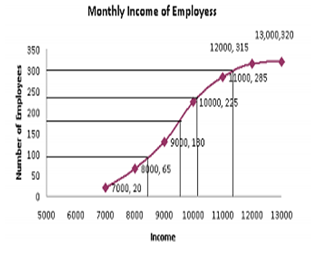
The monthly income of a group of 320 employees in a company is given below:
| Monthly Income | No. of employees |
| 6000 - 7000 | 20 |
| 7000 - 8000 | 45 |
| 8000 - 9000 | 65 |
| 9000 - 10000 | 95 |
| 10000 - 11000 | 60 |
| 11000 - 12000 | 30 |
| 12000 - 13000 | 5 |
Draw an ogive the given distribution on a graph sheet taking 2 cm = Rs. 1000 on one axis and 2 cm = 50 employees on the other axis. From the graph determine:
(i) the median wage
(ii) the number of employees whose income is below Rs. 8500.
(iii) if the salary of a senior employee is above Rs. 11,500, find the number of senior employees in the company.
(iv) the upper quartile.
| Monthly Income | No. of employees | c.f. |
| 6000 - 7000 | 20 | 20 |
| 7000 - 8000 | 45 | 65 |
| 8000 - 9000 | 65 | 130 |
| 9000 - 10000 | 95 | 225 |
| 10000 - 11000 | 60 | 285 |
| 11000 - 12000 | 30 | 315 |
| 12000 - 13000 | 5 | 320 |


 Switch


