 Long Answer Type
Calculate the mean of the following distribution using step deviation method
| Marks | 0 - 10 | 10 - 20 | 20 - 30 | 30 - 40 | 40 - 50 | 50 - 60 |
| Number of students | 10 | 9 | 25 | 30 | 16 | 10 |
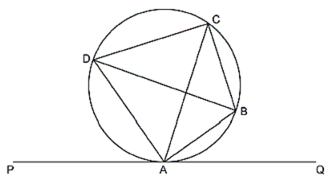
In the given figure PQ is a tangent to the circle at A, AB and AD are bisectors of , prove that:
(i) BD is a diameter of the circle
(ii) ABC is an isosceles triangle
The printed price of an air conditioner is Rs. 45000/-. The wholesaler allows a discount of 10% to the shopkeeper. The shopkeeper sells the article to the customer at a discount of 5% of the marked price. Sales tax ( under VAT ) is charged at the rate of 12% at every stage. Find:
(i) VAT paid by the shopkeeper to the government
(ii) The total amount paid by the customer inclusive of tax.
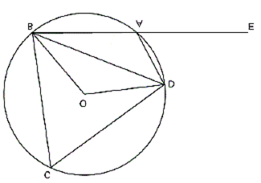
In the figure given, O is the centre of the circle. DAE = 70o, Find giving suitable reasons the measure of:
(i) BCD
(ii) BOD
(iii) OBD
A ( -1, 3 ), B ( 4, 2 ) and C ( 3, -2 ) are the vertices of a triangle.
(i) Find the coordinates of the centroid G of the triangle
(ii) Find the equation of the line through G and parallel to AC
The sum of the ages of Vivek and his younger brother Amit is 47 years. The product of their ages in years is 550. Find their ages.
The daily wages of 80 workers in a project are given below.
| Wages ( in Rs. ) |
400 - 450 | 450 - 500 | 500 - 550 | 550 - 600 | 600 - 650 | 650 - 700 | 700 - 750 |
| No. of workers | 2 | 6 | 12 | 18 | 24 | 13 | 5 |
Use a graph paper to draw an ogive for the above distribution. ( Use a scale of 2 cm = Rs. 50 on x-axis and 2 cm = 10 workers on y-axis ). Use your ogive to estimate:
(i) the median wage of the workers
(ii) the lower quartile wage of workers
(iii) the numbers of workers who earn more than Rs. 625 daily
The cumulative frequency table of the given distribution is as follows:
| Wages in Rs. | Upper Limit | No. of workers | cumulative frequency |
| 400 - 450 | 450 | 2 | 2 |
| 450 - 500 | 500 | 6 | 8 |
| 500 - 550 | 550 | 12 | 20 |
| 550 - 600 | 600 | 18 | 38 |
| 600 - 650 | 650 | 24 | 62 |
| 650 - 700 | 700 | 13 | 75 |
| 700 - 750 | 750 | 5 | 80 |
The Ogive is as follows:
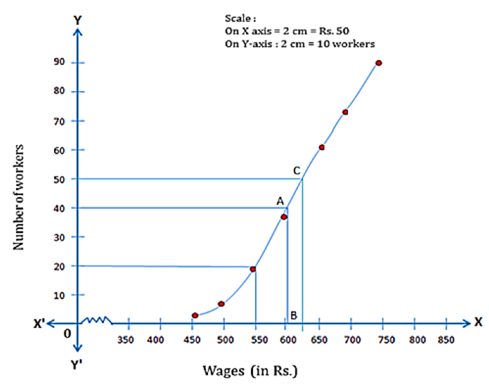
Number of workers = n = 80
( i )
Through mark 40 on the Y-axis, draw a horizontal line which meets the curve at point A.
Throughpoint A, on the curve draw a vertical line which meets the X-axis at point B.
The value of point B on the X-axis is the median, which is 605.
( ii )
( ii ) Through mark of 625 on X-axis, draw a vertical line which meets the graph at point C.
Then through point C, draw a horizontal line which meets the Y-axis at the mark of 50.
Thus, number of workers that earn more than Rs..625 daily = 80 - 50 = 30.
The angles of depression of two ships A and B as observed from the top of a light house 60 m high are 600 and 450 respectively. If the two ships are on the opposite sides of the light house, find the distance between the two ships, Give your answer correct to the nearest whole number.
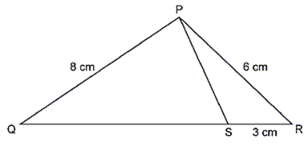
PQR is a triangle. S is a point on the side QR of PQR such that PSR = QPR. Given QP = 8 cm, PR = 6 cm and SR = 3 cm
(i) Prove PQR SPR
(ii) Find the length of QR and PS
(iii)


 Switch


