 Long Answer Type
The 4th term of an A.P. is 22 and 15th term is 66. Find the first term and the common difference. Hence find the sum of the series to 8 terms.
Use Graph paper for this question. A survey regarding height (in cm) of 60 boys belonging to Class 10 of a school was conducted. The following data was recorded:
| Height in cm | 135 - 140 | 140 - 145 | 145 - 150 | 150 - 155 | 155 - 160 | 160 - 165 | 165 - 170 |
| No. of boys | 4 | 8 | 20 | 14 | 7 | 6 | 1 |
Taking 2 cm = height of 10 cm along one axis and 2 cm = 10 boys along the other
axis draw an ogive of the above distribution. Use the graph to estimate the following:
(i) the median
(ii) lower Quartile
(iii) if above 158 cm is considered as the tall boys of the class. Find the number of
boys in the class who are tall.
The cumulative frequency table of the given distribution table is as follows:
| Height in cm | No. of boys ( f ) | Cumulative frequency |
| 135 - 140 | 4 | 4 |
| 140 - 145 | 8 | 12 |
| 145 - 150 | 20 | 32 |
| 150 - 155 | 14 | 46 |
| 155 - 160 | 7 | 53 |
| 160 - 165 | 6 | 59 |
| 165 - 170 | 1 | 60 |
Plot the points ( 140, 4 ), ( 145, 12 ), ( 150, 32 ), ( 155, 46 ), ( 160, 53 ), ( 165, 59 ) and ( 170, 60 ) on a graph paper and join them to get an ogive.
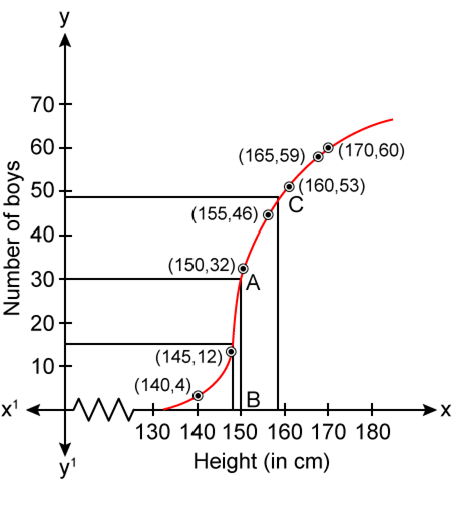
No. of boys = N = 60
Through mark 30 on the Y-axis, draw a horizontal line which meets the curve at point A.
Through point A, on the curve draw a vertical line which meets the X-axis at point B.
The value of points B on the X-axis is the median, which is 152.
( ii ) Lower quartile ( Q1 ) =
( iii ) Through mark of 158 on X-axis, draw a vertical line which meets the graph at point C.
Then through point C, draw a horizontal line which meets the Y-axis at the mark of 48.
Thus, number of boys in the class who are tall = 60 - 48 = 12.


 Switch


