 Multiple Choice Questions
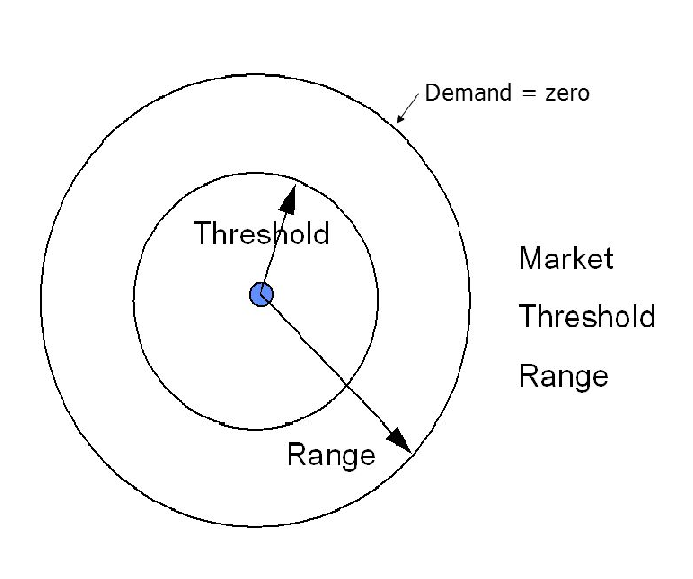
Which he one of the following statements correctly depicts threshold according to the Central Place Model ?
Point at the consumer movement is minimum.
Distance far which consumer will travel for a service.
Minimum number of people needed to support a service.
Economic base of a service centre.
|
LIST I (Demographic Terms) |
LIST II (Explanation) |
| (a) Cohart | (i) Birth rate minus death |
|
(b) Natural increase |
(ii) A population group unified by a specific common characteristic |
| (c) Total Fertility rate | (iii) Average number of children that a women will bear through her child bearing years. |
| (d) Dependency ratio | (iv) Measure in terms of number of dependents against productive age groups. |
(a)-(iii) , (b)-(iv) , (c)-(ii) , (d)-(i)
(a)-(ii) , (b)-(i) , (c)-(iii) , (d)-(ii)
(a)-(iv) , (b)-(ii) , (c)-(i) , (d)-(iii)
Which one of the following groups of states of India recorde more than one fourth of total population of the country in the census year 2011?
Uttar Pradesh , Assam , Punjab.
Uttar Pradesh , Madhya Pradesh , Karnataka.
Uttar Pradesh , Andhra Pradesh , Punjab.
Uttar Pradesh , Gujarat , Haryana
Among the following scholars, who introduced the concept of 'least-transport-cost location' using the frame of "locational triangle" ?
W.Isard
M.K.Bandman
D.M.Smith
A.Weber
The Rimmer model for the development of land transport system in less developed economies was proposed in which of the following years ?
1975
1976
1977
1978
|
LIST I (Whittlesey's Agricultural Regions) |
LIST II (Name of the Countries) |
| (a) Commercial Dairy Farming | (i) Argentina |
| (b) Commercial Grain Framing | (ii) Sri Lanka |
| (c) Nomadic Herding | (iii) New Zealand |
| (d) Commercial Plantations | (iv) Mangolia |
(a)-(iii) , (b)-(i) , (c)-(iv) , (d)-(ii)
(a)-(i) , (b)-(ii) , (c)-(iii) , (d)-(iv)
(a)-(iv) , (b)-(iii) , (c)-(ii) , (d)-(i)
(a)-(ii) , (b)-(iv) , (c)-(i) , (d)-(iii)
Which one of the following factors most dominant in the localisation of high-tech firms of silicon valley of California ?
Cheap Labour
Access to the market
High Speed transportation
Agglomeration economy
The formula PI = Y/Yn ÷ T/Tn where PI = Agricultural Productivity Index ; Y = Total production of selected crops in unit area ; Yn = Total production of same selected crops at national level ; T = Total cropped raea of the unit ; Tn = Total cropped area at national scale .
Who applied the formula for measuring agricultural productivity levels ?
Bhatia
Enyedi
Weaver
Shafi
B.
Enyedi
|
LIST I (Countries) |
LIST II (Mineral Resources) |
| (a) Liberia | (i) Iron |
| (b) Guinea | (ii) Uranium |
| (c) Togo | (iii) Phosphate |
| (d) Niger | (iv) Bauxite |
(a)-(iv) , (b)-(iii) , (c)-(ii) , (d)-(i)
(a)-(i) , (b)-(iv) , (c)-(iii) , (d)-(ii)
(a)-(ii) , (b)-(i) , (c)-(iv) , (d)-(iii)
(a)-(iii) , (b)-(ii) , (c)-(i) , (d)-(iv)
Which one of the following Models is explained by the given figure below ?

Weber's Model
Central Place Model
Von Theunan Model
Gravity Model
