Plot a labelled graph of [Vs] where Vs is stopping potential of photoelectrons versus frequency ‘f’ of incident radiation. How will you use this graph to determine the value of Planck’s constant? Explain
Graph of [V
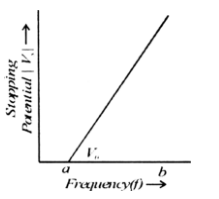
S](Stopping potential) versus frequency f.
This graph is drawn by taking frequency along X-axis and stopping potential along Y-axis as shown in fig.
At starting it is a straight line. The X-intercept gives the threshold frequency v0. So there is no photoelectric emission. Slope of the graph = h/e.
We can find the slope of graph easily.
The value can also be found from the graph.
In this graph, e = b -a
Therefore, by finding the value of e and slope of graph we can find the Plank’s constant K.
Plank’s constant, K = Slope of graph x e
786 Views


