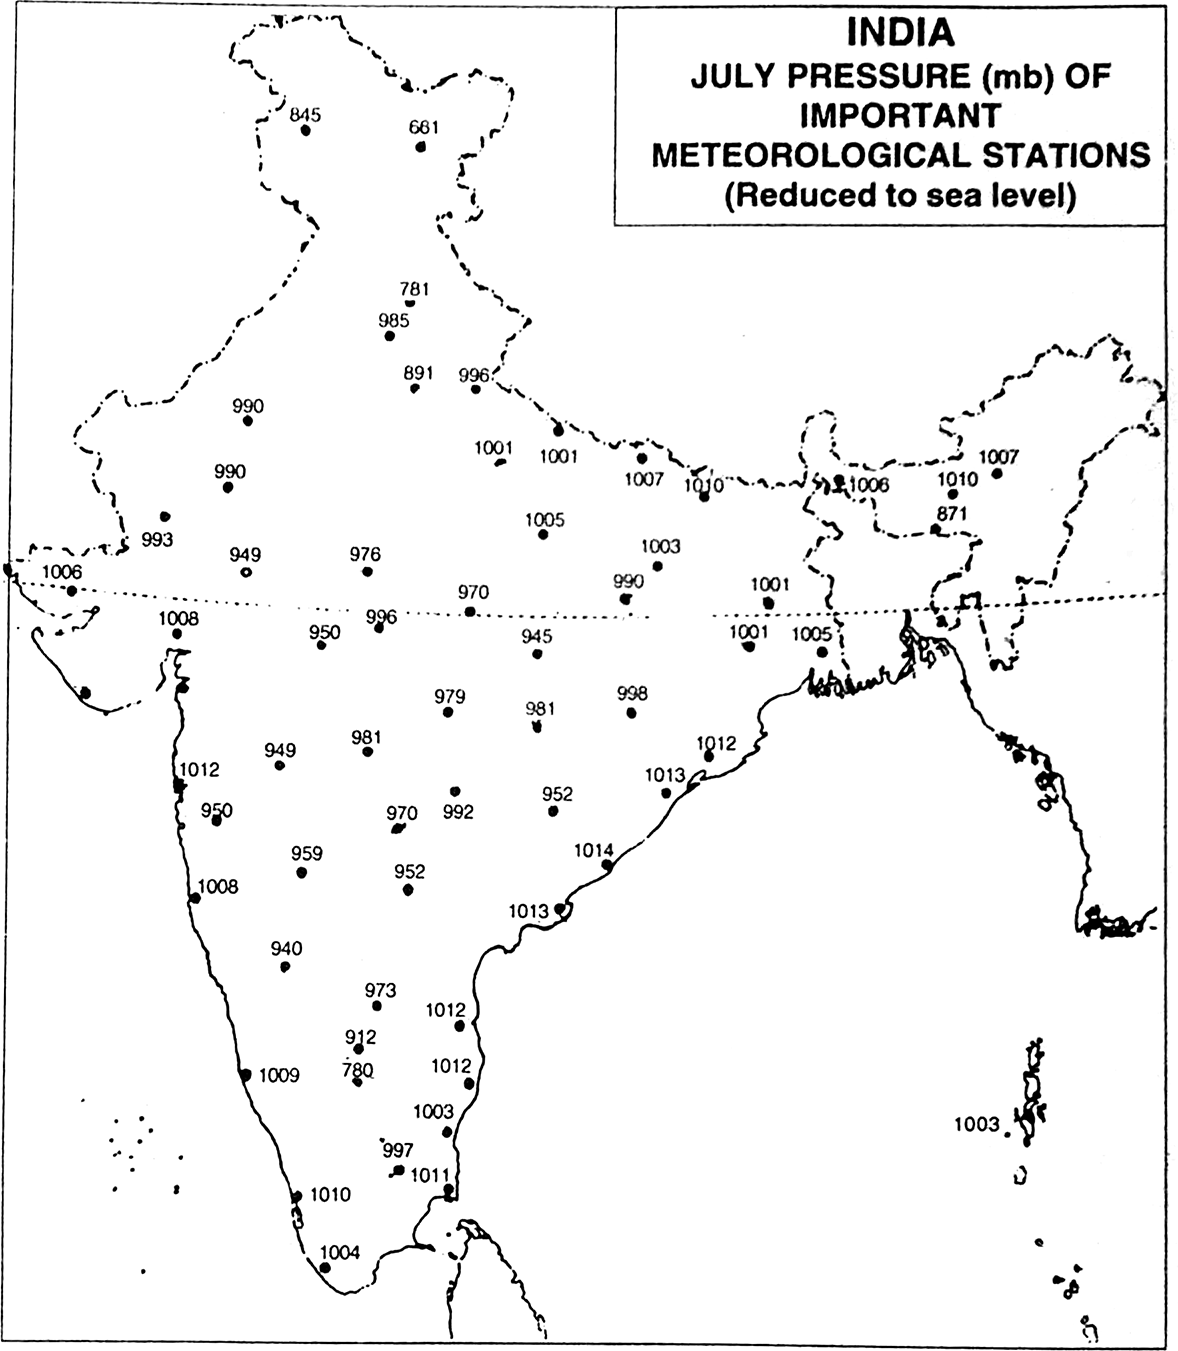
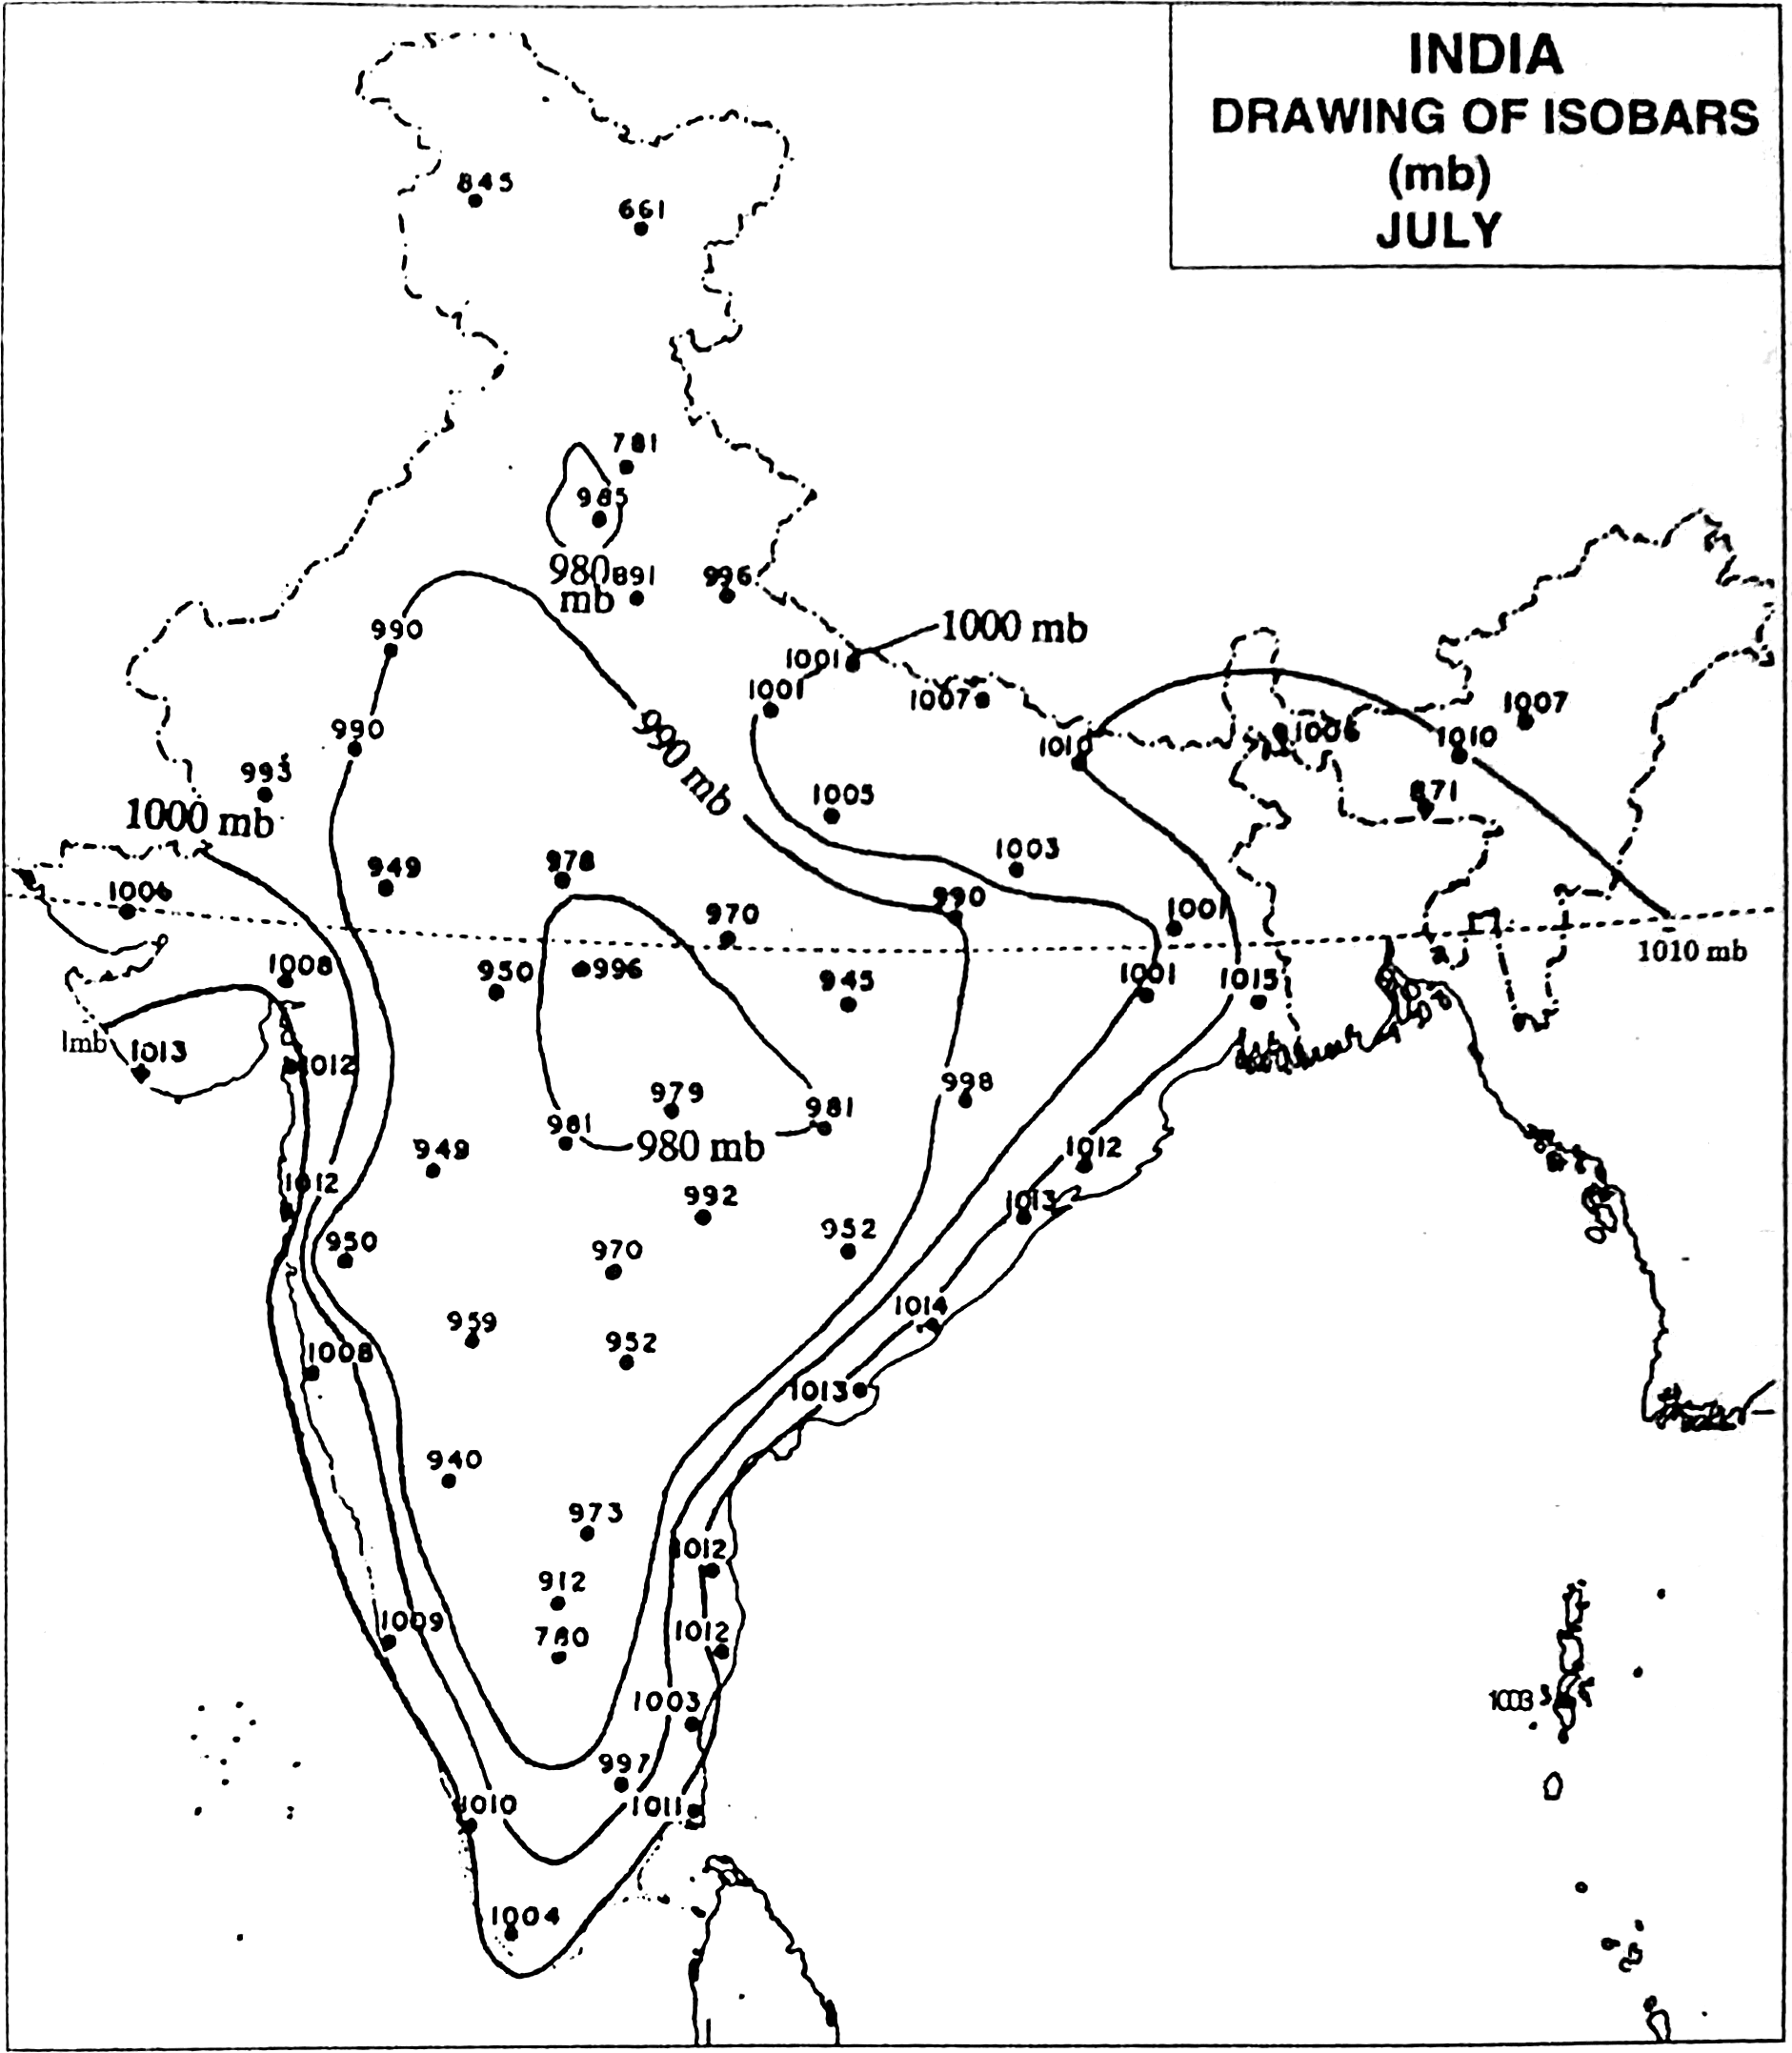
Draw isobars on the map of India shown in the following fig. on which mean monthly pressure (mb) for the month of July has been indicated for a number of meteorological stations.
- Zigya
Draw isobars on the map of India shown in the following fig. on which mean monthly pressure (mb) for the month of July has been indicated for a number of meteorological stations.
398 Views
Advertisement
Graphical Representation Of Data
Hope you found this question and answer to be good. Find many more questions on Graphical Representation Of Data with answers for your assignments and practice.
Practical Work in Geography Part I
Browse through more topics from Practical Work in Geography Part I for questions and snapshot.