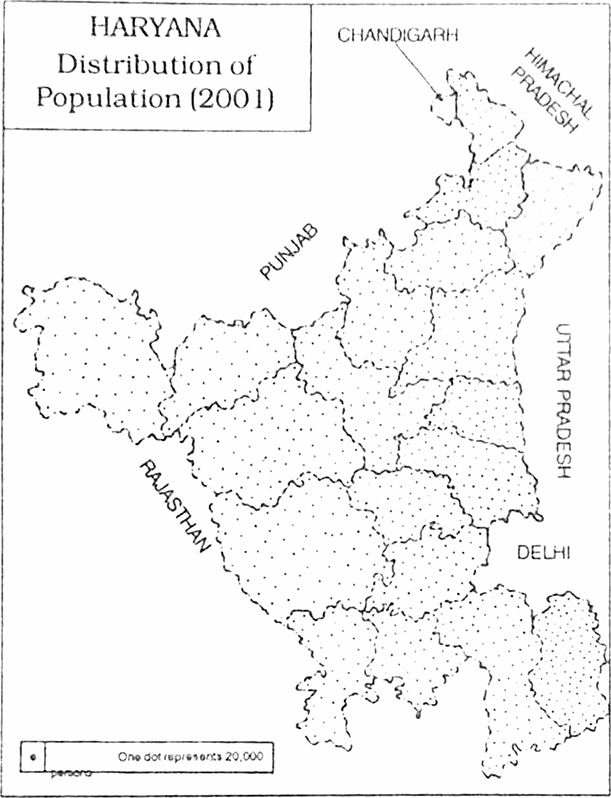
Draw a dot map of Haryana to show the distribution of population on the basis of data given below.
Distribution of Population in Haryana in 2001 :
|
S.No. |
Names of the Districts |
Population |
|
1. |
Faridabad |
21, 93, 276 |
|
2. |
Gurgaon |
16,57,669 |
|
3. |
Hisar |
15,36,417 |
|
4. |
Bhiwani |
14,24,554 |
|
5. |
Sonepat |
12,78,830 |
|
6. |
Karnal |
12,74,843 |
|
7. |
Jind |
11,89,725 |
|
8. |
Sirsa |
11,11,012 |
|
9. |
Ambala |
10,13,660 |
|
10. |
Yamunanagar |
9,82,369 |
|
11. |
Panipat |
9,67,338 |
|
12. |
Kaithal |
9,45,631 |
|
13. |
Rohtak |
9,40,036 |
|
14. |
Jhajjar |
8,87,392 |
|
15. |
Kurukshetra |
8,28,120 |
|
16. |
Mahendragarh |
8,12,022 |
|
17. |
Fatehabad |
8,06,158 |
|
18. |
Rewari |
7,64,727 |
|
19. |
Panchkula |
4,69,210 |
|
Haryana |
2,10,82,989 |
|
Source: Census of India 2001, Haryana, Provisional Population Tables Paper 1, p40.
Since the data are available according to districts, we must have an outline map of Haryana on which boundaries of all the 19 districts are drawn. Taking into consideration the size of the districts and their population figures, fix the value of each dot. Supposing each dot represents a population of 20,000. The number of dots to be put in each district is calculated by dividing total population by the fixed value of dot. The calculation of number of dots in each district is done according to the following table. If the number of dots is in decimals or fractions, they are to be converted into whole numbers.
Calculate the number of dots required for each district when each dot represents 20,000 persons. For example, the dots for Faridabad district will be 219376 % 20,000 = 109.66 round to 110 dots. Similarly calculate the number of dots for each district. On the outline map of Haryana mark the towns and cities and negative areas with pencil. Put more dots near towns and cities and leave out negative areas. Size of the dots should be suitably selected, so that they don't look either too crowded or too sparsely distributed. The size of the dots should remain the same at every spot.

