Draw the graphs for the following tables of values, with suitable scales on the axes,Interest on deposits for a year.(i) Does the graph pass through the origin?(ii) Use the graph to find the interest on Rs 2500 for a year.(iii) To get an interest of Rs 280 per year, how much money should be deposited?   - Zigya
Advertisement

Draw the graphs for the following tables of values, with suitable scales on the axes,
Interest on deposits for a year.
(i) Does the graph pass through the origin?
(ii) Use the graph to find the interest on Rs 2500 for a year.
(iii) To get an interest of Rs 280 per year, how much money should be deposited?


Steps:
I. Draw axes.
II. Take appropriate scale on x-axis and y-axis.
III. Mark the deposits along the x-axis.
IV. Mark the interest along the y-axis.
V. Plot the point (1000, 80) (2000, 160), (3000, 240), (4000, 320) and (5000, 400).
VI. Join the points and get the graph.

Steps:I. Draw axes.II. Take appropriate scale on x-axis and y-axis.

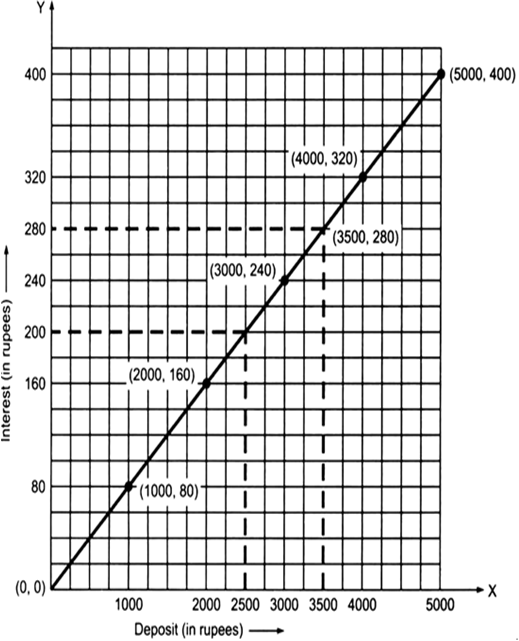
 Now from the graph, we have:
(i) Yes, it passes through the origin.
(ii) From the graph, the interest on Rs 2500 is Rs 200.
(iii) From the graph an interest of Rs 280 can be got by depositing Rs 3500.

348 Views

Advertisement

Introduction to Graphs

Hope you found this question and answer to be good. Find many more questions on Introduction to Graphs with answers for your assignments and practice.

Mathematics

Browse through more topics from Mathematics for questions and snapshot.