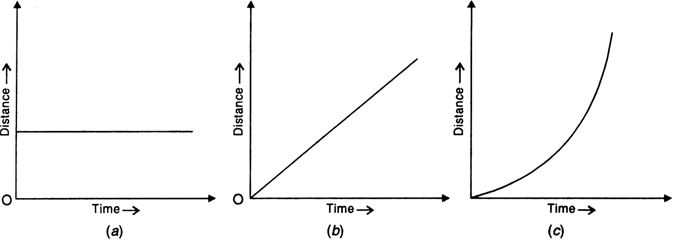
What is distance-time graph of a body? Draw distance-time graphs for,
(i) a stationary body,
(ii) a body moving with uniform velocity, and
(iii) a body moving with variable velocity.
Distance-time graph. It is a graph obtained by plotting distance travelled along Y-axis and time taken along X-axis.
(i) Distance-time graph for stationary body. The position of a stationary body does not change with time. So distance-time graph for a stationary body is a straight line parallel to time axis, as shown in Fig. 8.7 (a).
(ii) Distance-time graph for uniform velocity. For a body moving with uniform velocity, the distance travelled is proportional to the time taken. So distance-time graph is a straight line inclined to the time axis, as shown in Fig. 8.7 (b).
(iii) Distance-time graph for variable velocity. When a body moves with variable velocity, it covers unequal distances in equal intervals of time. So the distance-time graph is not a straight line but it is a curve, as shown in Fig. 8.7 (c).

