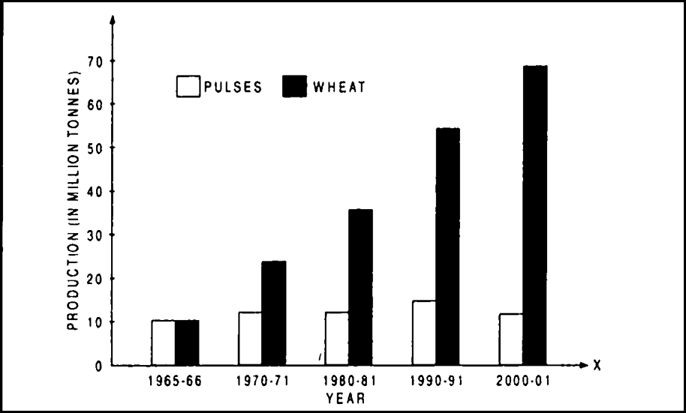
The following table shows the production of wheat and pulses in India after the Green revolution in units of million tonnes. Plot this on a graph.
Was the Green revolution equally successful for both the crops?
Table 1.2 : Production of pulses and wheat.
|
Year |
Production |
Production |
|
of Pulses |
of Wheat |
|
|
1965-66 |
10 |
10 |
|
1970-71 |
12 |
24 |
|
1980-81 |
11 |
36 |
|
1990-91 |
14 |
55 |
|
2000-01 |
11 |
70 |

