(Use a graph paper for this question.) The daily pocket expenses of 200 students in a school are given below:
| Pocket expenses (in Rs.) | Number of students(Frequency) |
| 0 - 5 | 10 |
| 5 - 10 | 14 |
| 10 - 15 | 28 |
| 15 - 20 | 42 |
| 20 - 25 | 50 |
| 25 - 30 | 30 |
| 30 - 35 | 14 |
| 35 - 40 | 12 |
Draw a histogram representing the above distribution and estimate the mode from the graph.

The Mode of Graph is 21.
The weight of 50 workers is given below :
| Weight in Kg | 50 - 60 | 60 -70 | 70 -80 | 80 -90 | 90 -100 | 100 -110 | 110 -120 |
| No. of Workers | 4 | 7 | 11 | 14 | 6 | 5 | 3 |
Draw an ogive of the given distribution using a graph sheet. Take 2 cm = 10 kg on one axis and 2 cm = 5 workers along the other axis. Use a graph to estimate the following:
(i) The upper and lower quartiles.
(ii) If weighing 95 kg and above is considered overweight, find the number of workers who are overweight.
The cumulative frequency table of the given distribution table is as follows:
| Weight in Kg | Number of Workers | Cumulative Frequency |
| 50 - 60 | 4 | 4 |
| 60 - 70 | 7 | 11 |
| 70 -80 | 11 | 22 |
| 80 - 90 | 14 | 36 |
| 90 - 100 | 6 | 42 |
| 100 - 110 | 5 | 47 |
| 110 - 120 | 3 | 50 |
The ogive is as follows:

The number of workers = 50
(i) Upper quartile (Q3) =
Lower quartile (Q1) =
(ii) Through mark of 95on the x axis,draw a vertical line which meets the graphat point C.
Then through point C, draw a horizantal line which meets the y-axis at the mark 39.
Thus, the number of workers weighing 95 kg and above = 50 - 39 = 11
Use Graph paper for this question. A survey regarding height (in cm) of 60 boys belonging to Class 10 of a school was conducted. The following data was recorded:
| Height in cm | 135 - 140 | 140 - 145 | 145 - 150 | 150 - 155 | 155 - 160 | 160 - 165 | 165 - 170 |
| No. of boys | 4 | 8 | 20 | 14 | 7 | 6 | 1 |
Taking 2 cm = height of 10 cm along one axis and 2 cm = 10 boys along the other
axis draw an ogive of the above distribution. Use the graph to estimate the following:
(i) the median
(ii) lower Quartile
(iii) if above 158 cm is considered as the tall boys of the class. Find the number of
boys in the class who are tall.
The cumulative frequency table of the given distribution table is as follows:
| Height in cm | No. of boys ( f ) | Cumulative frequency |
| 135 - 140 | 4 | 4 |
| 140 - 145 | 8 | 12 |
| 145 - 150 | 20 | 32 |
| 150 - 155 | 14 | 46 |
| 155 - 160 | 7 | 53 |
| 160 - 165 | 6 | 59 |
| 165 - 170 | 1 | 60 |
Plot the points ( 140, 4 ), ( 145, 12 ), ( 150, 32 ), ( 155, 46 ), ( 160, 53 ), ( 165, 59 ) and ( 170, 60 ) on a graph paper and join them to get an ogive.
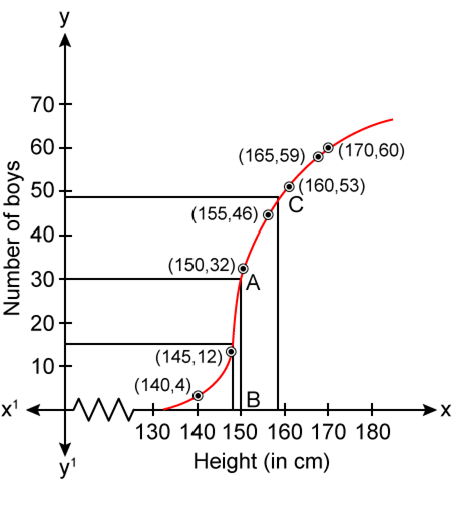
No. of boys = N = 60
Through mark 30 on the Y-axis, draw a horizontal line which meets the curve at point A.
Through point A, on the curve draw a vertical line which meets the X-axis at point B.
The value of points B on the X-axis is the median, which is 152.
( ii ) Lower quartile ( Q1 ) =
( iii ) Through mark of 158 on X-axis, draw a vertical line which meets the graph at point C.
Then through point C, draw a horizontal line which meets the Y-axis at the mark of 48.
Thus, number of boys in the class who are tall = 60 - 48 = 12.
Draw a histogram from the following frequency distribution and find the mode from the graph:
| Class | 0 - 5 | 5 - 10 | 10 - 15 | 15 - 20 | 20 -25 | 25 - 30 |
| Frequency | 2 | 5 | 18 | 14 | 8 | 5 |
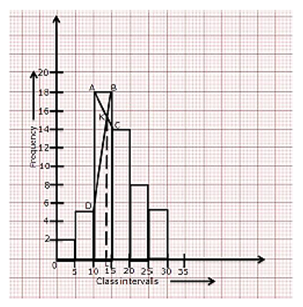
Steps to calculate mode from the graph:
(i)Mark the end points of the upper corner of rectangle with maximum frequency
as A and B.
(ii) Mark the inner corner of adjacent rectangles as C and D.
(iii) Join AC and BD to intersect at K. From K, draw KL perpendicular to x-axis.
(iv) The value of L on x- axis represents the mode.
Thus, Mode = 13
A Mathematics aptitude test of 50 students was recorded as follows:
| Marks | 50 - 60 | 60 - 70 | 70 - 80 | 80 - 90 | 90 - 100 |
| No. of Students | 4 | 8 | 14 | 19 | 5 |
Draw a histogram from the above data using a graph paper and locate the mode.
The histogram for the given data can be drawn by taking the marks on the x-axis and the number of students on the y-axis.

To locate the mode from the histogram, we proceed as follows:
(i) Find the modal class. Rectangle ABCD is the largest rectangle. It represents the modal class, that is, the mode lies in this rectangle. The modal class is 80 – 90.
(ii) Draw two lines diagonally from the vertices C and D to the upper corners of the two adjacent rectangles. Let these rectangles intersect at point H.
(iii) The x-value of the point H is the mode. Thus, mode of the given data is approximately 83.


 Switch


