We have
y = 4x + 3 Table of solutions
|
X |
0 |
1 |
|
y |
3 |
7 |

We plot the points (0, 3) and (1, 7) on a graph paper and join the same by a ruler to get the line, which is the graph of the equation y = 4 x + 3.
This gives the work wages graph of the given equation.
Now, on x-axis, take a point P(4, 0). From P draw a line parallel to y-axis intersecting the work wage graph at Q. From Q, draw a line parallel to x-axis to intersect the y-axis at R. We see that R is (0,19). 2x + 3y = -5 3y = - 5 - 2x

Table of solutions
|
X |
–1 |
2 |
|
y |
–1 |
–3 |
We plot the points (–1, –1) and (1, –3) on a graph paper and join the same by a ruler to get the line which is the graph of the equation 2x + 3y = –5.
x + y = –1
⇒ y = – 1 – x
Table of solutions
|
X |
0 |
1 |
|
y |
–1 |
–2 |
We plot the points (0, –1) and (1, –2) on the same graph paper and join the same by a ruler to get the line which is the graph of the equation x + y = –1.
From graph, we see that the coordinates of the point of intersection of the two lines are (2, –3).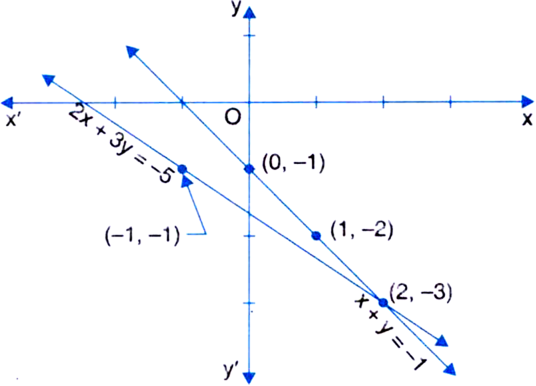
by = c
by = c
A.
ax + by + c = 0A.
–1, 2, –7

 Switch


