Multiple Choice Questions
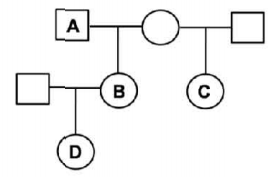
The coefficient of relatedness between individuals A and B, A and D, and between D and C is
0.5, 0.25, 0.125 respectively
0.5, 0.5, 0.25 respectively
0.5, 0.25, .75 respectively
0.125, 0.5, 0.5 respectively
A.
0.5, 0.25, 0.125 respectively
The coefficient of relatedness between individuals A and B, A and D, and between D and C is 0.5, 0.25, 0.125 respectively.
A particular behavioural variant affects the fitness of an organism. The relationship between the frequency of the variant in the population and fitness are plotted below. In which of these cases is the behavioural variant likely to reach a frequency of 1?
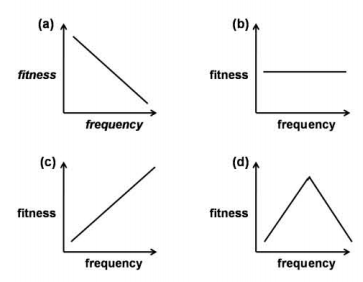
Only b
Only c
b and d
a and d
Consider an autosomal locus with two alleles A1 and A2 at frequencies of 0.6 and 0.4 respectively. Each generation, A1 mutates to A2 at a rate of μ = 1 × 10⁻⁵ while A2 mutates to A1 at a rate of 2 × 10⁻⁵. Assume that the population is infinitely large and no other evolutionary force is acting. The equilibrium frequency of allele A1 is
1.0
0.5
0.67
0.33
For two species A and B in competition, the carrying capacities and competition coefficients are-
KA = 150; KB = 200
α = 1.0; β = 1.3
According to the Lotka-Volterra model of interspecific competition, the outcome of the competition will be
Species A wins
Species B wins
Both species reach a stable equilibrium.
Both species reach an unstable equilibrium.
The birth rates (b) and death rates (d) of two species 1 and 2 in relation to population density (N) are shown in the graph. Which of the following is NOT true about the density-dependent effects on birth rates and death rates?
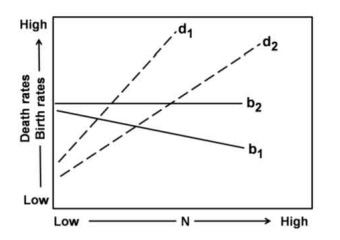
Birth rates are density-dependent in species 1 and density-independent in species 2.
Death rates are density-dependent in both the species.
The density-dependent effect on the birth rate is stronger in species 1 than in species 2.
The density-dependent effects on death rates are similar in both the species.
In a lake subjected to progressive eutrophication, temporal changes in the magnitude of selected parameters (A, B, C, D) are shown in the graph
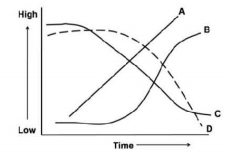
The parameters A, B, C, D are
A - Green algal biomass; B - Cyanobacterial biomass; C - dissolved oxygen concentration; D - Biological Oxygen Demand
A - Biological Oxygen Demand; B - Cyanobacterial biomass; C - Dissolved oxygen concentration; D - Green algal biomass
A - Biological oxygen demand; B - Green algal biomass; C - Cyanobacterial biomass; D - Dissolved oxygen concentration
A - Cyanobacterial biomass; B - Biological oxygen demand; C - Green algal biomass; D - Dissolved oxygen concentration
Match the following associations involved in dinitrogen fixation with their representative genera.
| Associations | Genera |
| A. Heterotrophic nodulate | i. Azotobacter |
| B. Heterotrophic Non-nodulate | ii. Frankia |
| C. Phototrophic associative | iii. Nostoc |
| D. Phototrophic free-living | iv. Rhodospirillum |
A - ii; B - i; C - iv; D - iii
A - iii; B - i; C - ii; D - iv
A - i; B - ii; C - iii; D - iv
A - ii; B - i; C - iii; D - iv
The following table shows the mean and variance of population densities of species A, B, and C.
| Statistic | Species A | Species B | Species C |
| Mean | 5.30 | 7.05 | 5.30 |
| Variance s2 | 5.05 | 0.35 | 50.5 |
Based on the above, which of the following statements is correct?
Species A and B show uniform distribution, whereas species C shows clumped distribution.
Species A shows the random distribution, species B shows uniform distribution, and species C shows clumped distribution.
Species A and B show clumped distribution, whereas species C shows uniform distribution.
Species A shows the clumped distribution, species B shows the random distribution, and species C shows uniform distribution.
The approximate P: B (Net Primary Production: Biomass) ratios in four different ecosystems A, B, C, D) are:
A - 0.29; B - 0.042; C - 16.48; D - 8.2
The four ecosystems are
A - Ocean; B - Lake; C - Grassland; D - Tropical forest
A - Grassland; B - Tropical forest; C - Ocean; D - Lake
A - Tropical forest; B - Ocean; C - Grassland; D - Lake
A - Grassland; B - Ocean; C - Lake; D - Tropical forest


 Switch